|
|||||||||||||||
|

 The S.M.A.R.T.
Silver Equation (reloaded)
The S.M.A.R.T.
Silver Equation (reloaded)| 2004 | 2006 | |
| Initial Price ($) | 5.20 | 5.25 |
| Velocity ($ per m) | - .052 | - .049 |
| Acceleration ($ per mm) | .000000014 | .00028 |
| Change in A ($ per mmm) | .000029 | .000017 |
I = $ 5.25 - This is the initial Silver price my program calculated at m=0, about 83 months ago, based on average monthly Kitco silver data I downloaded.
V = - $ 0.049 per month - This is Silver's initial price Velocity at Time=0. The minus sign says that the price was moving down initially, at an approximate average rate of 4.9 cents per month. Like North Korea's next A-bomb - falling from the sky.
A = $ .00028 per month per month - An initial SMART Force is acting to push the price positively and is changing the velocity faster by this rate every month. This is a small initial acceleration, although it is much larger than the 2004 value which was negligible! But that small number gets multiplied by the square of the month (m), and so the Velocity begins to change more quickly as the month (m) increases.!
Q = $ .000017 per month per month per month. The SMART Acceleration may start tiny, but it's increasing at a rate that is four orders of magnitude (powers of ten) larger than the Initial Acceleration. The Acceleration is changing by this rate every month. Thus, the $ Velocity changes faster and faster every month. Notice that this Q parameter becomes increasingly more important with time! The cube of month 10 = 1,000, but the cube of month 100 = 1,000,000! So Q grows one thousand times more important at month 100 than it is at month ten.
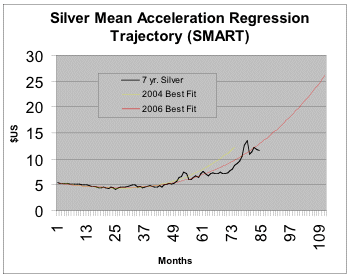
Rather than try to explain individually how these differences affect the trajectory in 2006 compared to 2004, it is much simpler to show the graph at this point. You can be the judge.
SMART Discussion
In general the new 2006 "best fit curve" clearly shows that Silver is still following a similar trajectory compared to 5 years ago; however, the curve has flattened slightly as a result of the extended price correction in 2004. Technically, the strongest and most important part of the equation, the Q component (rate of $ acceleration), has been reduced. I've a theory about that later...
What else does the SMART Curve tell us?
1. In general, the good news is that the curve still increases strongly and exponentially upward. This 2006 curve predicts that the POS will again double from about $12 this month (82), October 2006, to $24 in month 107, (November 2008, 25 months from now) - if it stays upon the path.
2. Price Position - The current Price of Silver is only about a dollar less than the 2006 SMART curve prediction, and we have been in a "normal" correction for about 6 months now already, and are coming up on the seasonally strongest time of the year for precious metals. The silver Prices are obviously quite cyclical and appear to be oscillating above and below the curve in a kind of sine wave. In my opinion, we should exceed the predicted values in the very NEAR future as Prices swing back to the other extreme.
3. Price Velocity - Price Velocity is still increasing dramatically.
4. Price Acceleration - Notice that the current Price levels are about 8 months behind the predicted 2004 Price values. It seems that there was some huge change in Price Pressure (the force that causes Price Acceleration - the force of Demand upon Supply) brought to bear on the Silver market which was above and beyond the normal cyclical nature of the rest of the curve. What could have caused the large change in $ pressure in 2004-2005? This is only speculation, but I wonder if the change in Price Pressure (supply/demand balance) was a result of Warren Buffett, when he (?was forced to?) put his 130 million ounces of silver back into circulation quite suddenly and unexpectedly! This added supply pressure in a fairly short period of time, would have caused just such a Price Deceleration. If so, then the effects would only be temporary, as the REAL overall world supply/demand has not changed. Short-term supply dumping of this nature would merely delay the immediate Silver supply problem by about 8 or 9 months until the excess supply was naturally digested by the market. Could this kind of dumping happen again? Yes. In my opinion, it could happen, but only if someone else has another 100 million ounces of silver to disinvest in a sudden random manner. Other than that, we might expect to eventually resume the HIGHER Silver Price Velocity and Price Acceleration of the 2004 curve. We will KNOW in only a couple more years!
In Conclusion
I will not try to speculate in this report what is coming next, and whether I think Silver is due to run into supply problems - like copper and zinc - causing it to explode in price. There are many rumours that real supply problems exist and manifest themselves already as delivery delays. There are some who think otherwise. It would be wise however, for all investors to research the Silver supply/demand fundamentals for themselves, and especially to assess the possibility of supply problems or outright contract defaults, related to the unnaturally large Commercial Traders short positions as written about for many years by Ted Butler and others.
Note also several other interesting new Price Pressures that Silver Demand will make on Silver Supply in the next year or two:
1. Renewed investor interest as Asia expands and the world commodity war heats up.
2. As a result of environmental laws, changes to world electronics manufacturing which used over 100 million ounces of lead annually as a major component in solder, now will cause silver to be used instead for at least some applications. I don't know what percentage of the new solders used will be silver, only that it is a preferred alloy, and a potentially large demand situation.
3. Silver threads are now being woven into cloth for anti-bacterial clothing. I purchased such a shirt for myself several months ago from LuluLemon, a growing yoga and sports clothing supply chain. I expect this application to grow even more quickly in coming years, as the odour fighting qualities of the cloth become more widely known and marketed.
4. Silver use in all types of bacteria fighting is on the increase, including silver coatings in refrigerators and washing machines as well as hospital applications such as wound dressings for burn victims.
5. Silver usage is growing in power transmission systems, where it is used as a low loss electrical super-conductor.
6. Silver Exchange Traded Funds or ETFs are sprouting up like Hedge Funds, all over the world. A new one started yesterday in Shanghai I believe.
7. New Silver-Zinc batteries for laptops that don't explode!
All of the above and more are already represented in the curve to some extent. These new forces of Silver demand, and many others, are causing the Silver Price Acceleration which will cause the SMART Curve to continue to rise exponentially until higher prices eventually choke off demand. This will only happen at much higher prices in my opinion, as silver prices are currently trading at VERY low historical ratios compared to all other metals, both base and precious. The amount of silver in any of these new products (except the ETF) amounts to only pennies per item. There is MUCH more room to fly for this rocket.
To those potential investors who are worried about government intervention in the silver market, remember these little-known corollaries of Newton's Laws of Motion:
1. A Silver Rocket in motion will stay in motion, and cannot be stopped by any external force from the FED - because their force is spent.
2. Silver Projectiles cause
Negative Acceleration to Government Vampirism!
Rock on!
October 31, 2006
Rock Gale
Ottawa, Canada
email: rockgale@yahoo.ca
Rock Gale Archives
Copyright ©2002-2006 Rock Gale. All Rights Reserved.
Disclosure Statement:
I currently own lots of lovely, shiny Silver Coins, as well as
myriad Silver and Gold Mining Shares... My Precioussss!... Do
not believe anything I say, (don't even believe this), because
in spite of my scientific genius, I am a mere human; therefore,
I am highly biased, overly emotional, and probably legally insane.
(I am not!)
321gold Inc
![]()