Super Force Signals - A Leading
Market Timing Service
We Take Every Trade Ourselves
Gold Stocks Set To Overwhelm Gold
Morris Hubbartt
Weekly Market Update Excerpt
posted Nov 23, 2012
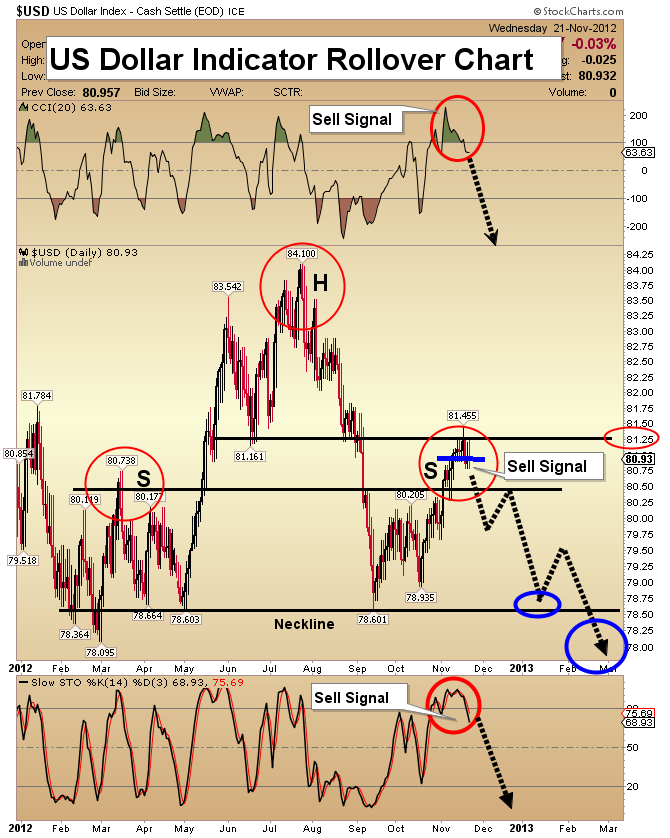
US Dollar Indicator Rollover Chart
- The topping process in the US dollar is accelerating. Currency analysis requires patience, because during a rollover, technical indicators can move at a snail's pace.
- The declining indicators are accompanied by weak volume, suggesting the price of the dollar is heading quite a bit lower.
- My focus is the neckline on the head & shoulders top at 78.60. Once the dollar closes below that level for two consecutive trading days, a downside target of 73 will be in play.
- Note the clear sell signals on both technical indicators. I like to see the slow Stokes falling under 80, soon after the CCI has spiked to at least 200. These indicator sell signals suggest there is a high probability that the right shoulder of the h&s top will quickly collapse.
- This bearish US dollar chart is very good news, for gold investors!
Gold Arc Breakout Chart
- My technical analysis indicates that a major long term bottom is in place, across the entire precious metals sector. The intermediate term target is $2015, but gold could move even higher before correcting significantly.
- When CCI spikes lower, as it did recently, followed by RSI touching the 30 level, a trending move higher is very likely.
- Note the large green Fibonacci arc pattern that I have highlighted. Gold rose to the outer arc in September. From there, it pulled back, bottoming in early November.
- Gold has now exhibited several daily closes above that outer arc, which is very bullish. The short term target is $1850, and it could be acquired quickly.
GDX Arc Action Chart
- The technical pattern in GDX that is developing is bullish. Fibonacci arc analysis suggests that once GDX closes over $53, a new bull leg is in play.
- My intermediate term target is $66. If gold overshoots $2015, I believe GDX could rise to $72.
GDX Overwhelms Gold Chart
- Fundamental and technical analysis suggests higher gold stock prices are coming. What is most compelling about gold stocks is the undervaluation of the sector against gold itself.
- On this chart, you can see that GDX is as cheap as it was during the meltdown of 2008.
- There is a substantial head & shoulders pattern in play now. Aggressive investors could consider selling some bullion, and using the proceeds to take an overweight position in gold stocks.
- I am projecting that gold stocks will rise to about .44 on this ratio chart, which is almost a 50% gain from the current price.
GDXJ Uptrend Time Chart
- The debt crisis could transform into a currency crisis. That would create a surge in demand for gold. The source of new metal is junior mining companies.
- Fundamentally, gold juniors probably have more to offer than any sector in the precious metals sector. Senior companies are having a hard time proving up new reserves.
- In the short term, I expect GDXJ to acquire a price of $28 per share. That would take it to the outer edge of the Fibonacci arc, and usher in an enormous trending move to the upside.
Silver Turn and Confirm Chart
- Silver is my second largest holding. Sentiment seems to be, “just about right”, for a powerful move higher.
- Bob Moriarty of 321Gold recently pointed out that the premium on the Sprott Physical Silver Trust hit an important low. This is very encouraging.
- Silver is trading about 27% off its highs of last summer. Note how similarly CCI and RSI are positioned now, compared to the August period. A huge rally occurred then. I expect an even bigger one now.
- After pulling back to the downtrend line that defined the entire correction, silver is beginning to move higher. All my “technical lights” are green!
Friday, May 2, 2025 Super Force Signals Unique Introduction For 321Gold Readers:
Send an email to admin@supergoldsignals.com and I’ll send you my free “Inflation Thunder Now!” gold stocks video report. I’ll also include 3 of my next Super Force Surge Signals free of charge, as I send them to paid subscribers. Thank you!
|
Stay alert for our Super Gold alerts, sent by email to subscribers,
for both the daily charts on Super Force Signals at www.supergoldsignals.com and for the 60 minute
charts at www.supergoldsignals.com
About Super
Gold Signals:
Our Surge Gold Signals are created thru our proprietary blend
of the highest quality technical analysis and many years of successful
business building. We are two business owners with excellent synergy.
We understand risk and reward. Our subscribers are generally successfully
business owners, people like yourself with speculative funds,
looking for serious management of your risk and reward in the
market.
Frank Johnson:
Executive Editor, Macro Risk Manager.
Morris Hubbartt: Chief Market Analyst, Trading Risk Specialist.
website: www.supergoldsignals.com
email:
admin@supergoldsignals.com
email: admin@supergold60.com
Mail:
1276 Lakeview Drive
Oakville, Ontario, L6H 2M8
Canada
###
Nov 23, 2012
Morris Hubbartt
321gold
Ltd
 |
