|
|||
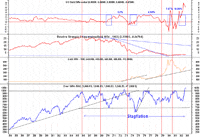
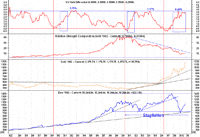
1970-1982 A Possible Roadmap Part 2Troy Schwensen Back in June 2006 I wrote an article called 1970-1982 A Possible Roadmap Part 1 which looked at the economic similarities between the first half of this decade and the 1970’s. In this article, we revisit the comparison and take it to its conclusion to the end of 1982. In just over 3 years, since the first article was written, a lot has occurred shedding some important light on the subject. When we continue to compare the two periods, some important differences are becoming increasingly apparent. The chart below contains a lot of information. In the top section, we look at the yield differential between 10 year and 3 month bonds. When this hits zero or less (otherwise known as yield inversion), the risk of a recession over the next 6-12 months becomes very high. The recessions are denoted by the blue rectangles. The percentage figures across the top are the three month bond yields at the point when short term rates start rising again and the yield differential narrows. This typically occurs 12 - 18 months after the recession has finished and monetary policy is tightened to counter inflationary pressures. Studying these percentages over the 12 year period from 1970 to 1982 reveals a rising trend as inflationary concerns increased. This eventually culminated in Federal Chairman Paul Volker’s aggressive tightening of interest rates towards the end of the period. In the next section we take a look the Dow Jones Index performance relative to Gold. We can see from 1970 through to 1982 gold outperformed the Dow Jones hands down. This signaled the lengthy period of stagflation throughout the best part of the decade. The US drifted in and out of recession an amazing 4 times. A look at the next section shows the dramatic rise in the gold price as interest rate levels failed to adequately protect investors against the vast increase in the money supply and the severe price inflation which followed. The last section looks at the Dow Jones index which was stuck in a range for close to 16 years from 1966 – 1982. (Click on images to enlarge) 1954 - 1982 1982 - Current We fast forward to the present day and at first glance we are looking at a very similar picture. We see over the last 10 years that the US has endured a couple of recessions. Gold has outperformed the Dow Jones in no uncertain fashion. Both charts share very similar characteristics. If we take a closer look, however, there are some disturbing differences. Firstly, a look at the 3 month bond rates at the post recession turning points over the last 20 years sees a marked trend lower. This starts with 3.25% back in 1990 and falls to 1.17% in 2002 and has since fallen to 0.46% at the peak of the yield differential back in October 2008. It is important to note, however, that we are yet to technically break the current recession which is closing in on its 2 year anniversary. During the 1970s, the gold standard had only recently been abolished and debt levels were not nearly as crippling as they are today. The recessions, though frequent, lasted no longer than a year. Interest rates were slashed each time and the desired effect experienced at least for a short while. As we close in on 2010, the world has been operating under a fiat monetary system for close to 40 years. Central banks have been playing the game of slashing and raising rates to the point where they can hardly slash anymore. They have already severely compromised the value of money which is clearly evident in the gold price. The game plan has now been reduced to desperate quantitative easing measures (printing money) to maintain some semblance of control. If “successful” in their actions, the US economy will rebound to the point where the US Fed can perhaps raise short term rates and close the interest rate differential once more. What then you might ask? The US will inevitably go into yet another recession which will be met with the same policy of aggressive rate cutting (with whatever interest rate remains). This will have next to no positive effect on the economy. Why? To answer this we need to consider what credit is and what it means for an economy. When we or the government borrow to consume, we are effectively bringing forward future consumption to today. This compensates for the lack of present day consumption brought about by an inadequate or non-existent level of savings. At some point, there has to be a day of reckoning when the mountain of debt starts getting repaid. That day comes when debt levels are no longer sustainable (people and government can no longer afford to take on more debt) and little if any consumption can be brought forward in time. There is strong evidence to suggest that the public have hit this debt ceiling. The government on the other hand has put up its hand to try and make up for the shortfall. In the 1970s, Paul Volker successfully raised short term rates aggressively and restored the purchasing power of money. To attempt this now, with the current level of debt the public and the government are encumbered with, would be economic suicide. The game the Federal Reserve is attempting to play is to inflate this debt away by devaluing the dollar, which they hope to do in a structured and controlled manner. For this to work, however, wages would need to rise to make up for the diminishing purchasing power of the dollar. With the US firmly entrenched in recession, the likelihood of this policy being successfully implemented seems very unlikely. The more you compare our present situation to that of the 1970s, the more you start to appreciate some of the very distinct differences. So far the landscape looks quite similar. The stock market and the gold price are behaving in a consistent manner. This shouldn’t come as any surprise given the policy being employed, while more desperate, is by in large the same. For as long as it “works” and staves off a collapse in the financial system, expect to see more of the same with increasing levels of volatility. Make no mistake, however, that the present policies of quantitative easing and attempting to spend our way out of trouble is doomed to ultimate failure. How financial markets behave under these circumstances will be anyone’s guess. While I would like to think that precious metals related investments will provide some kind of safety net, one can’t be entirely certain. I think the metal itself in the aftermath will offer the ultimate safety. Gold stocks need some degree of confidence and do not tend to perform as well in times of market uncertainty. Thinking of what might eventually happen has highlighted the importance of holding an increasing part of my portfolio in the metal itself. Deflationists will argue that cash is the place to be. Money gets its value from people having confidence in the financial system and a government which demonstrates intent to preserve its purchasing power. This would mean allowing interest rates to rise to the appropriate levels needed to cleanse the economy and the financial system of significant mal-investment. It would mean tighter fiscal controls with the realization that ongoing deficit spending is severely compromising the future viability of the US government. Having witnessed how government and central banks have responded so far, I don’t hold much confidence that they will do the right thing any time soon. These actions would ultimately break the system sooner rather than later. This would inflict too much pain and collateral damage to be politically tenable. I therefore get the feeling that the status quo will be maintained until the system ultimately fails. Governments will then be forced into making the inevitable tough decisions which have been confronting them for years. I repeat, money retains its value and appeal when governments honor their responsibilities of preserving its worth. Without a gold standard, there are next to no checks and safety mechanisms in place to ensure this happens. If we take this scenario to its logical conclusion, I fear the system will break down regardless of what measures are taken and when. It has now become a case of the longer we leave it, the worse the recovery process is going to be. Using history as a guide, gold in my opinion will be one of the few beneficiaries in both the short and the longer term. Admittedly, this is very different to the 1970s and early 80s where difficult decisions were voluntarily made as the US entered their third and fourth recessions. Confidence in the US dollar was restored and the gold price consequently decimated. I often get people asking me whether this is it for gold and how much higher could we possibly go? My answer is always the same. As long as governments flagrantly compromise the purchasing power of money, we will continue to see the gold price rise. There is little doubt in my mind that the easy options will be taken for as long as possible. Quantitative easing and the open market purchase of bonds and any other assets deemed necessary will be persistently applied, but will not be sustainable in the long run. I think the Dow Jones will inevitably meet the Gold price 1:1 in the future. Whether this occurs at 10,000 or 2,000 remains to be seen and will largely be determined by how long the powers that be retain control. Either way, we as investors need to take the necessary precautions. For anyone interested, I write a free monthly newsletter on the precious metals markets. This includes technical analysis as well as company updates on many prominent precious metals companies from around the world. Pay us a visit at the website below. Alternatively, for all the latest fundamental information on gold stocks and sophisticated tools in which to utilize it, I invite you to visit GoldNerds. Many articles demonstrating how we have employed the product to identify undervalued gold stocks are available at The Global Speculator website. ### Dec 16, 2009 Editor Editor GN North America In our ongoing effort to develop a comprehensive information package for gold investors, the recently released North American version of the GoldNerds product includes a rolling 4 quarter summary of actual ongoing capital expenditure. It also provides a forward looking forecast of ongoing capital incorporating up and coming projects (this feature will soon be added to the Australian version of the product). These numbers are then integrated into a formula which adds an estimate of the future average cash cost (assuming all projects are developed), the enterprise value per mineable oz (customized indicator) and future construction capital (associated with undeveloped projects) to provide users with a useful Total Cost per oz estimate. This enables investors to effectively compare gold mining companies from a very unique and useful perspective. If you are serious about researching gold mining companies I encourage you to pay us a visit. The North American version covers most of the established producers and many of the up and coming development companies listed on the North American exchanges. Disclaimer |


