|
|||
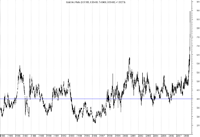
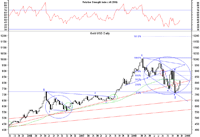
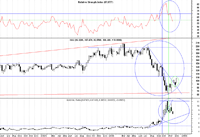
Gold/XAU Ratio - Last 25 YearsTroy Schwensen The following is an extract from the December 08 Issue of TheGlobal Speculator sent to subscribers on the 15th of December 2008. In the theme of market irrationality, I thought it would be interesting to take a look at the Gold XAU ratio for the last 25 years. Relative to the price of gold, gold shares in recent months have hit unprecedented oversold levels. We have heard extensively how deleveraging from hedge funds has driven the commodity complex sharply lower. Some major gold mining companies are trading at forward price earnings ratios of under 10, something I have not seen in the entire time I have been following these markets. Other junior miners with producing assets are trading for less than their Net Financial Asset positions. Could this dislocation worsen from here? Anything's possible given the tremendous fear that has gripped our markets. Long term however, history has proven that whilst anything can deviate significantly above and below its fair value, eventually gravitation to the average becomes inevitable. The long term average for the Gold XAU ratio is 4. At the present time, the ratio is close to double this level. In just 3 months it has doubled from 4.75 to over 10. If the ratio can move that quickly up, it can certainly rebound just as violently the other way. As a long term investor in the precious metals markets, you need to ask yourself whether you can afford to be sitting on the sidelines waiting for the dust to settle (speculative stance). As primarily a longer term investor, I am not prepared to take that risk. 25 Year Gold XAU Ratio Gold Wave Analysis Update Commentary The 'abcde' corrective pattern appears to be complete, paving the way for the next substantial wave 3 rally. The next intermediate term target is US$1,200/oz, with significant resistance still to be overcome at US$835, US$860, US$900 and then the previous weekly high of US$1,010. We will continue to monitor the gold shares for a clue as to the probable success of these levels being broken over the coming weeks and months. XAU With the unprecedented moves we have seen in the XAU in recent months, I have been forced to rethink my use of the XAU/Gold ratio. The use of absolute values worked well for the first 5 years of this bull market, but with the increased volatility it is no longer effective. Instead, I have devised a modification which incorporates the Gold XAU ratio in a weekly chart with a look at a relative strength index to indicate the extreme movements and potential entry and exit points. It seems to work more effectively and highlights key points in time when the XAU is overbought relative to gold (RSI 30) and oversold (RSI 70). Once the respective indicators trigger (blue vertical lines), it then becomes a task of following trends in the ratio looking for definitive breaks to signify entry (green vertical lines) and exit (red vertical lines) points. The gold price wave analysis helps us get our bearings. Gold/XAU Long term Picture Gold XAU Ratio
Gold/XAU Intermediate Term Commentary We can see, looking at the extreme movement in the RSI in late Oct 08, that there has been one huge dislocation in the PM markets with the shares strongly underperforming the metal (I didn't need to tell you that!). On a brighter note, things look to have stabilized with a nice breakout occurring in the XAU (middle section). The gold shares are displaying strength versus the metal with a move in the Gold/XAU ratio breaking a shorter term up trend (green vertical line) being bullish in its implications. The next trend line of more significance sits at around the 7 level. A break of this trend line would reinforce the theory that the gold price has commenced its next wave 3 move and that gold shares are typically leading the way. Closing Comments It has been an amazing three month period since the last issue. We have seen the XAU fall to levels not seen since 2002, shortly after the secular bear market in gold finished. We have seen gold shares, relative to the gold price, hit levels never seen before in the history of the XAU. Nothing has changed fundamentally for gold as central banks around the world continue to cut rates drastically in an attempt to stimulate the world economy and save countless financial institutions from collapsing. 2009 promises to be a very difficult year as people endeavor to seek financial safety. At the moment that perceived safety is in cash and government bonds. When you look at how governments and central banks are attempting to solve this growing list of problems (via increasing levels of stimulus), I find it increasingly difficult to see attractiveness in either of these alternatives. One thing that has become very apparent to me is neither the governments nor the central banks have a grip on this problem. To keep your savings in pieces of paper which essentially rely on both organizations getting things right is an incredible leap of faith in my humble opinion. Gold is at record levels in many currencies and has provided the perfect hedge against what is going on around us. My feeling is it will continue to fulfill this role as it has done countless times before throughout history. For anyone interested I write a free newsletter on the precious metals market which you can sign up for at the website below. Past issues of the newsletter may also be accessed at the website below. Troy Schwensen CPA Troy Schwensen
is a full time investor/Trader who spent 8 years in the Accounting
and Finance industry which included roles with blue chip Australian
companies such as Goodman Fielder and Fosters where he spent three
years as a Senior Business Analyst. He made a decision to leave
this industry in 2002 after discovering a long term opportunity
to invest and trade in the precious metals market where he has
since used his analytical skills to build a sound working knowledge
of the sector and its comprising companies. |


