|
|||
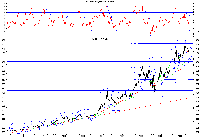
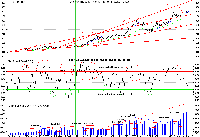
Gold Price consolidation in progressTroy Schwensen With the gold price consolidation in progress, I hope you are all taking advantage of this lull in the sector to take a break! If we revisit our Gold Wave Analysis chart below, we can see not a lot has happened since the last issue more than 2 months ago. The gold price finally made what looks like a “b” interim high and is now tracing what appears to be a typical “b” to “c” move. An intermediate term up trend, which had been in place since our last “c” low back in late 2008, has recently broken having short term bearish implications. How low we go from here is anyone’s guess. A logical target in the past has been the 65 week moving average (green line). This usually gets touched in “b” to “c” retracements. In 2008, it was massacred but I wouldn’t be expecting a repeat of that this time around! At the present time, it is sitting at US$1,090 and is still trending higher. Our last “a” correction tested US$1,050. This makes US$1,050 to US$1,100 a logical support zone and target. Timeframe wise, the next 2-3 months seems the most likely with a strong rebound to come later in 2010. Also look for the 45 level in the RSI (top section) to be breached as it has during other “b” to “c” retracements. Gold Wave Analysis (Click on images to enlarge) Gold COT report If we revisit our COT report, we can see that the Net Short Commercial position as a percentage of total Commercial Open Interest (COI) (middle section) has declined down to 37% which is again consistent with a gold price in consolidation mode. Anything less than 30% has generally been a good entry price for investors as the commercials cover their short positions in preparation for the next phase higher in this bull market. Note how gold has its strongest rallies when this indicator is trending higher and eventually tops out in the 50-65% zone as speculative long interest runs out of steam and the commercials employ their usual bullying tactics! For anyone interested, I write a free monthly newsletter on the precious metals markets. Pay us a visit at the website below. Alternatively, for all the latest fundamental information on gold stocks and sophisticated tools in which to utilize it, I invite you to visit GoldNerds. Many articles demonstrating how we have employed the product to identify undervalued gold stocks are available at The Global Speculator website. Pay us a visit. ### Aug 12, 2010 Editor Editor GN North America In our ongoing effort to develop a comprehensive information package for gold investors, the recently released North American version of the GoldNerds product includes a rolling 4 quarter summary of actual ongoing capital expenditure. It also provides a forward looking forecast of ongoing capital incorporating up and coming projects (this feature will soon be added to the Australian version of the product). These numbers are then integrated into a formula which adds an estimate of the future average cash cost (assuming all projects are developed), the enterprise value per mineable oz (customized indicator) and future construction capital (associated with undeveloped projects) to provide users with a useful Total Cost per oz estimate. This enables investors to effectively compare gold mining companies from a very unique and useful perspective. If you are serious about researching gold mining companies I encourage you to pay us a visit. The North American version covers most of the established producers and many of the up and coming development companies listed on the North American exchanges. Disclaimer |


