|
|||
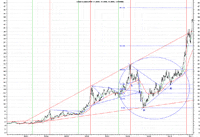
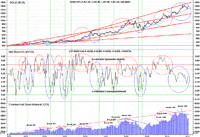
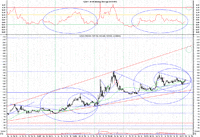
Making a case for gold in 2011!Troy Schwensen In this issue, we take a look at some charts to try and gauge where the gold sector is presently at and what lies ahead for 2011. Three charts in particular will be used to build what I consider to be a very strong case for a bullish 2011. Exhibit A: Bullish Weekly XAU Chart I have shown this chart on numerous occasions in previous issues. Having studied and used technical analysis for nearly 10 years, I have observed several unreliable patterns. There is, however, one pattern I will hang my hat on 9 times out of 10, particularly if the fundamentals support the bullish picture. That pattern is a Reverse Head and Shoulder as demonstrated above. For those of you unfamiliar with this pattern, it forms with a Left shoulder dip (L) followed by a much larger fall and rally which makes the head (H). This is then followed by a moderate correction and rally which forms the right shoulder (R). The line at the top of these three movements is called the neck line and for the XAU it presently sits around the 200 mark. You can measure a price target by taking the distance between the bottom of the head and the neckline. In this case we are looking at about 130 (200 less 70). If the neckline is broken with a rally, your target becomes 330 (200+130). Back in late 2010 we definitively broke the neckline. We have since corrected back to it which is actually not that uncommon. The neckline now needs to hold over the coming weeks and months before a much stronger rally begins. My guess is this will occur primarily during the second half of 2011. If the XAU (gold stocks) rallies this strongly, it is not much of a stretch to predict that the gold price will also rise significantly. Another example of a Reverse Head and Shoulder Pattern which played out last year was for silver. We highlighted this to our subscribers in the April/May 2010 issue of the newsletter (I encourage readers to check it out in the archive section of the website). The blue circled area demonstrates the pattern. Silver’s Strong Rally (A Reverse Head and Shoulder Which Delivered) Exhibit B: COT Report This next chart provides a graphical representation of the Commitment of Traders report (COT). Admittedly, we haven’t looked at this in a while. For those who are unfamiliar with it, I will provide you with a brief run down (it is not as complicated as it looks!). The top section is simply the gold price. The next two sections give an overview of the Gold Futures Contracts traded on the Futures Exchange. It specifically looks at what the Commercial traders are doing. The futures market is made up predominantly of Speculators and Commercials. The Speculators are always Net Long gold (buying) and the Commercials are always Net Short (selling), effectively making up the other side of the trade. The short term price movements in gold can be heavily influenced by the interaction between these two groups of traders. The bottom section of this chart represents the Commercial Open Interest, which is the number of contracts the Commercials have open. The middle section looks at the Commercial Net Short position as a % of the Open Interest. When the speculators are in control and the gold price is rising, the Net Short position of the Commercials increases as they are on the selling end of these trades. These strong gold price rallies usually coincide with a Net Short % of between 50 and 65% (red circled areas). As the rally in the gold price loses momentum, the Commercials start to exert their influence (they have much deeper pockets than the speculators). A sharp fall in the gold price usually follows, enabling them to cover their short positions by buying heavily from the Speculators who rush for the exit doors in a panic. These typical correction periods are shown by the blue circles. The Net Short % for the Commercials will typically fall to between 20 - 30% during these corrective phases as they close their trades (note the fall in Open Interest in the bottom section). This has provided a very useful buying indicator for gold in the past as noted by the green vertical lines. So where are we at today? Looking at the Commercial Net Short % (middle section), we can see that the Commercial shorts have been covering their positions, typical of a corrective phase in the gold market. However, note what the gold price has been doing during this particular phase. Where in the past the commercials have had the luxury of covering their shorts during a sell off in the gold price (blue circles), this time around the gold price has continued to trend higher! I see this as an extremely bullish development which indicates to me the game is changing and the Speculators are now being supported by the heavy investment demand we are seeing in the physical market. I think the Commercials are losing their heavy handed influence. This will give Speculators more confidence, fueling a much stronger sustainable rally in the gold price moving forward. Exhibit C: The Gold Price in Australian Dollars (ETF – 1/10th/oz) If the gold price is going to have a strong 2011, will this strength occur just in US dollars or will the holder of gold in other seemingly stronger currencies also benefit? The Australian dollar is a commodity based currency which has been strong in relative terms against most major currencies. We can see in the price chart above (bottom section) that since the rally during the Global Financial crises, the gold price in Australian dollars has been largely consolidating. The last similar consolidation occurred during 2007/2008 (Large blue circles). It is the similarity between these two consolidation periods I find to be quite interesting. The movements emulate each other, all the way down to the consolidation triangles that seemingly mark the last phase (smaller blue circles). My guess is the Aussie dollar gold price is approaching the conclusion of its current two year consolidation phase. The top section of this chart looks at the spot price as a % of the 40 week moving average. When the price action gets overbought, this tends to exceed 1.3 times. When the gold price is consolidating we can see a number of hits around the 0.95 times. This has typically been a good buying point in the past. If we look at the two circled areas, representing the consolidation periods, we again see a similarity in the movements between 1.15 and 0.95. We have a price target for 2011 of $190 - $200 (A$2,000/oz). For anyone interested, we write a free newsletter on the precious metals markets. Visit the Global Speculator website and sign up today. We have recently added a new interest group for historical research reports on gold and silver mining companies. Alternatively, for all the latest research reports and fundamental information I invite you to visit GoldNerds. ### Mar 4, 2011 Editor Editor GN North America In our ongoing effort to develop a comprehensive information package for gold investors, the recently released North American version of the GoldNerds product includes a rolling 4 quarter summary of actual ongoing capital expenditure. It also provides a forward looking forecast of ongoing capital incorporating up and coming projects (this feature will soon be added to the Australian version of the product). These numbers are then integrated into a formula which adds an estimate of the future average cash cost (assuming all projects are developed), the enterprise value per mineable oz (customized indicator) and future construction capital (associated with undeveloped projects) to provide users with a useful Total Cost per oz estimate. This enables investors to effectively compare gold mining companies from a very unique and useful perspective. If you are serious about researching gold mining companies I encourage you to pay us a visit. The North American version covers most of the established producers and many of the up and coming development companies listed on the North American exchanges. Disclaimer |


