|
|||
The Dow/Gold RatioRichard Russell
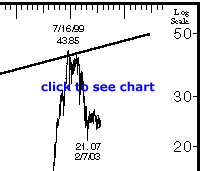
Here's what this crucially important chart tells us. First, it tells us that there is a cycle in the relationship of gold with the Dow. The cycle runs from a point where a few ounces of gold buys a share of the Dow -- to a point where it takes a good many ounces of gold to buy a share of the Dow. The low extremes during which an ounce or so of gold bought a share of the Dow occurred in 1896, 1932, and 1980. At the other extreme when it required a good many ounces of gold to buy a share of the Dow occurred in 1929, 1966, and 1999. So it's clear that it didn't take much gold to buy a share of the Dow at bear market lows in stocks. And it took a lot of gold to buy a share of the Dow at bull market highs in stocks. Note the rising trendline connecting 1929 and 1999. It's clear that at each successive peak it required substantially more gold to buy a share of the Dow. Based on the chart, it's obvious that in 1999 something changed in the Dow/gold relationship. In 1999 it required a record 43.85 ounces of gold to buy one share of the Dow. But in July of 1999 the ratio reversed, and a dramatic decline in the ratio began. The ratio dropped from 43.86 in 1999 to 21.07 in early-2003, a decline of 51 percent. In other words, it now takes only half as many ounces of gold to buy a share of the Dow as it did six years ago in 1999. Wait, let me bring the study up to date. The ratio low of 21.07 was recorded in February 2003. Since then the ratio has risen a bit to 23.7 today. From here on, we're forced to guess at the future of the ratio. Will the cycle continue as it has occurred before, and will the ratio decline to 1, 2 or 3? My guess is that it will. And if so, where will gold be, and where will the Dow be? I'm going to hazard a guess. I think we'll see the gold to Dow ratio decline to near 1. If the ratio is going back to 1, my guess is that we'll see both gold and the Dow at around 2000 to 2500. Fantastic, impossible, absurd? Never use any of those words about the markets -- where the markets are concerned, anything can happen! more follows for subscribers... Richard Russell © Copyright 1958-2014 Dow Theory Letters, Inc. Richard Russell began publishing Dow Theory Letters in 1958, and he has been writing the Letters ever since (never once having skipped a Letter). Dow Theory Letters is the oldest service continuously written by one person in the business. He offers a TRIAL (two consecutive up-to-date issues) for $1.00 (same price that was originally charged in 1958). Trials, please one time only. Mail your $1.00 check to: Dow Theory Letters, PO Box 1759, La Jolla, CA 92038 (annual cost of a subscription is $300, tax deductible if ordered through your business). |

