Precious Metals Market Timing
From the October 22nd Report
Ron Rosen
Oct 27, 2005
"Time is more important
than price; when time is up price will reverse." -W.D.
Gann
"But 'tween the child
and the grown-up, imagination grew
Ways and means for eyes to tease, over, around, and through
Crisscrossing reconnections, tap drummer's little snares
A dot to dash, to energize, reflections the shell wears
Between logic and emotion, between good-night and mourn
The child spun a hiding place, I never knew I'd worn"
This report is my attempt to
use graphic logic and not emotion. The hiding place may be found
in the first quarter of 2006. Once there we may find the lows
for the gold and silver complex, shares included, and crude oil.
We may have to look up to find
the U.S. Dollar index making a recovery high.
If all unfolds as Delta Long
Term turning points appear to be saying, it will be time to add
to or reenter the gold and silver share market. Having it all
come together in the first quarter of 2006 may be too much to
expect. However, I believe the odds of this happening are very
good.
I have included wave counts
and potential bottoming areas based on Fibonacci corrections.
If between now and the first quarter of 2006 gold closes over
its 23 year overhead resistance and the HUI closes over 260,
I will consider that the beginning of the next bullish phase.
As far as the first quarter of 2006 being the bottom we are looking
for, let us remember this:
"The best laid schemes
o' mice an' men / Gang aft a-gley." Robert Burns
Comments are posted with the
charts.
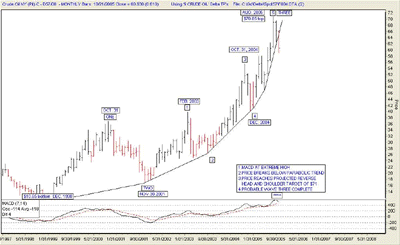
This chart shows what followed
an extreme high reading of the MACD technical indicator. The
current probable significance of this reading is shown on the
next chart.
CRUDE OIL MONTHLY
CHART
(click on image
to enlarge)

At the same time the MACD technical
indicator reached an extreme high, the following events occurred:
1. The price of crude oil broke
its' parabolic rise.
2. The price reached its projected
target of $71.00 ( see next chart)
3. A probable wave Three is
complete.
CRUDE OIL MONTHLY
CHART
(click on image
to enlarge)
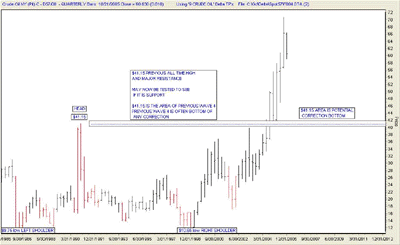
This chart shows how the projected
price of $71.00 was obtained. This is a standard method of attempting
to determine what the potential price will be after a head and
shoulder formation is completed.
CRUDE OIL QUARTERLY
CHART
(click on image
to enlarge)

"Richard Brock of Richard
Brock & Associates recalls a financial management conference
he attended in New York. Most of the commodity index funds in
attendance had committed 55-65 % of their managed assets to energy,
vs. a mere 20-30 % in less exciting agricultural commodities.
Brock claims the fund managers told him, "No way can this
market go down like tech in 1999-2000."
"In August, it was reported
that the latest sentiment poll by Ned Davis research showed 81.3
% bulls in energy futures. (about as extreme as they've been
over the past decade)"
These quotes are from Past,
Present, Futures by James Flanagan 1-800-545-9331.
CRUDE OIL QUARTERLY
CHART
(click on image
to enlarge)
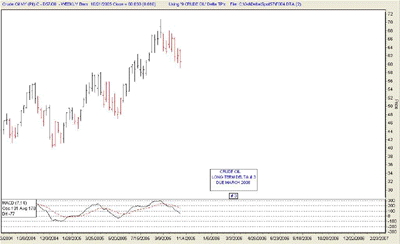
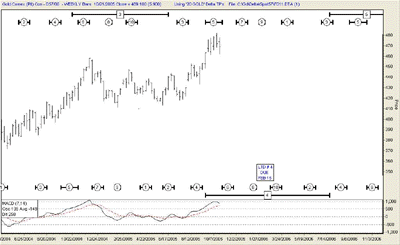
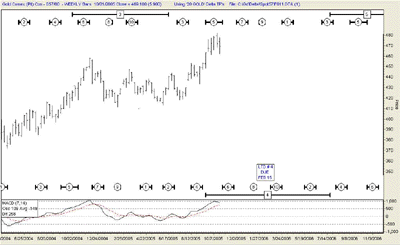
Crude oil and Gold have a Long
Term Delta LOW due in the first quarter of 2006.
CRUDE WEEKLY CHART
(click on image
to enlarge)
 GOLD WEEKLY CHART
(click on image
to enlarge)

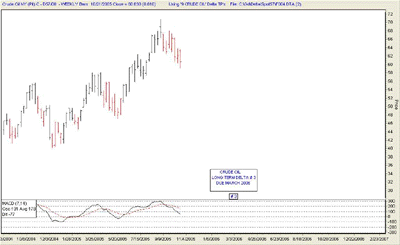
The next two charts are just
larger versions of the above two charts.
CRUDE OIL WEEKLY
CHART
(click on image
to enlarge)
 GOLD WEEKLY CHART
(click on image
to enlarge)
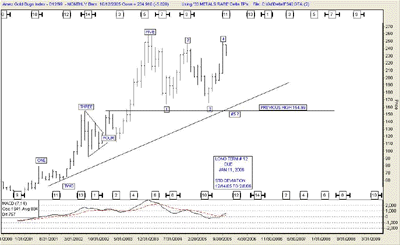
The HUI has a long Term Delta
# 12 LOW due January 12, 2006. There is a reasonable probability
that the HUI will make a new low and bottom in the 150 area.
If it does, it will violate the major long term major trend line.
This would be normal because each phase usually establishes its
own major trend line. This break would complete the first phase.
HUI WEEKLY CHART
(click on image
to enlarge)
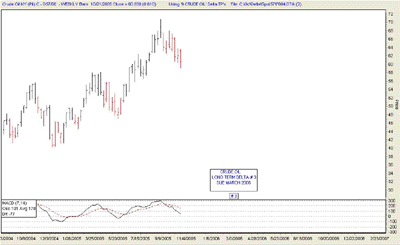
The next page shows that crude
oil, gold and the HUI all may bottom in the first quarter of
2006.
Crude oil weekly
long term bottom due March 2006
(click on image
to enlarge)
Gold weekly long
term bottom due Feb 2006
(click on image
to enlarge)
HUI monthly long
term bottom due Jan 2006
(click on image
to enlarge)

Silver bullion has a Delta
Long Term LOW # 4 due in February, 2006.
SILVER BULLION WEEKLY
CHART
(click on image
to enlarge)

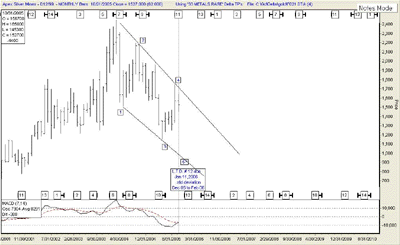
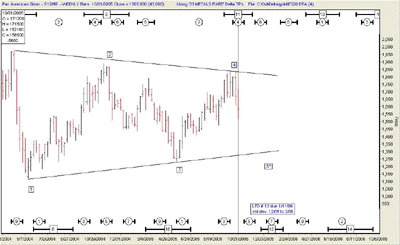
All of the Silver shares have
the same turning points. They have a Delta Long Term LOW due
in January 2006.
APEX SILVER MONTHLY
CHART
(click on image
to enlarge)
 PAN AMERICAN SILVER
WEEKLY CHART
(click on image
to enlarge)
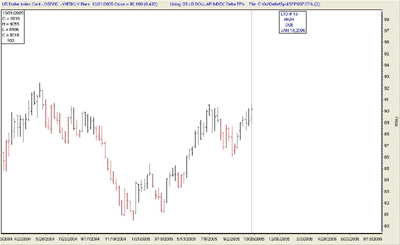
The U.S. Dollar Index is due
for A Delta Long Term # 13 high January 2006.
U. S. DOLLAR INDEX
WEEKLY CHART
(click on image
to enlarge)
If (there's always an if) gold,
the hui, silver, the silver shares, crude oil and the dollar
all arrive at their respective Delta long Term turning points
as projected, we may be witness to a major turn in those markets
the first quarter of 2006.
There really is a good
chance of this happening, so let's just
"IMAGINE"
--------------
By John Lennon
"You may say I'm
a dreamer,
but I'm not the only one...."


Stay Well,
Oct 22, 2005
Ron Rosen
email: rrosen5@tampabay.rr.com
Subscriptions
are available at:
www.wilder-concepts.com/rosenletter.aspx
 Disclaimer: The contents of this
letter represent the opinions of Ronald L. Rosen and Alistair
Gilbert. Nothing contained herein is intended as investment
advice or recommendations for specific investment decisions, and
you should not rely on it as such. Ronald L. Rosen and Alistair
Gilbert are not registered investment advisors. Information and
analysis above are derived from sources and using methods believed
to be reliable, but Ronald L. Rosen and Alistair Gilbert cannot
accept responsibility for any trading losses you may incur as
a result of your reliance on this analysis and will not be held
liable for the consequence of reliance upon any opinion or statement
contained herein or any omission. Individuals should consult with
their broker and personal financial advisors before engaging in
any trading activities. Do your own due diligence regarding personal
investment decisions. Disclaimer: The contents of this
letter represent the opinions of Ronald L. Rosen and Alistair
Gilbert. Nothing contained herein is intended as investment
advice or recommendations for specific investment decisions, and
you should not rely on it as such. Ronald L. Rosen and Alistair
Gilbert are not registered investment advisors. Information and
analysis above are derived from sources and using methods believed
to be reliable, but Ronald L. Rosen and Alistair Gilbert cannot
accept responsibility for any trading losses you may incur as
a result of your reliance on this analysis and will not be held
liable for the consequence of reliance upon any opinion or statement
contained herein or any omission. Individuals should consult with
their broker and personal financial advisors before engaging in
any trading activities. Do your own due diligence regarding personal
investment decisions.
The Delta Story
Tee charts reproduced
courtesy of The Delta Society International.
321gold Inc

|