Precious Metals Market Timing
From the October 15th Report
Ron Rosen
Oct 17, 2005
"Time is more important
than price; when time is up price will reverse." -W.D.
Gann
GOLD AND SILVER SHARES
Gold and Silver shares
topped in December of 2003. They have undergone a long, painful
and sometimes confusing correction. I believe the correction
is almost over. There are perhaps 3 to 5 months and one more
move down to complete this exhausting process. Throughout this
corrective period there has been a great deal of bullish talk
and writing about the precious metals and how high they will
fly. I suspect the final wave down will tend to diminish the
bullishness to some extent. Let's say that we are taxiing down
the runway and there is just one more pothole left. Once past
that, we are ready to lift off. In this report I have attempted
to show just how difficult it is to project what type of correction
we are undergoing. It is well known amongst those who seriously
study wave theory that corrective waves are extremely difficult
to identify, compared to what is called impulse waves. I was
able to identify the completion of the first phase of the bull
move in the HUI with a fair amount of ease. Although I did say
to myself, "Can this really be the top of the first phase?"
The reason I questioned my opinion was the extreme amount of
bullishness at that top. There were a number of very prominent
analysts and letter writers that differed with my interpretation.
Some folks were quite annoyed at my opinion. I have constantly
stated that if, at any time, the HUI closes over 260 and gold
bullion closes over its long term resistance, we should add to
or reenter the market at that time, regardless of my interpretation
of the correction. The reason for that statement was and is the
fact that corrective waves are very difficult to hone in on with
a high degree of probability. It appears that the closer they
are to completion the more identifiable they become. Thus in
my opinion there is one more wave down. A number of good technicians
disagree with that opinion. There are opinions and then there
are opinions. Here's one for the road. When the silver shares
finally break out and start to move they will appear to be jet
propelled. I don't think we can or will miss the take off.
CORRECTIVE WAVES
"Markets move
against the trend of one greater degree only with a seeming
struggle. Resistance from the larger trend appears to prevent
a correction from developing a full impulsive structure. The
struggle between the two oppositely trending degrees generally
makes corrective waves less clearly identifiable than impulsive
waves, which always flow with comparative ease in the direction
of the one larger trend. As another result of the conflict between
trends, corrective waves are quite a bit more varied than impulsive
waves." E.W.T.
I originally thought this would be a three wave "flat"
correction. It has morphed into a different type as I recently
explained. I now believe one more wave down is necessary for
completion. You can see that the five waves of the upward impulse
are much less complicated and easier to decipher. The only confusion
might be over wave five. Wave three is supposed to be the biggest.
However, in commodities and commodity producing stocks, wave
five is most often the biggest. Wave four was a triangle, which
is what it should be if wave five is going to be very big. It
really was easy to read the first bull phase. Right now trying
to interpret this corrective wave, I feel as though I am peeking
through a blindfold. However, please allow me to whisper, "I
think I am correct that there is one more wave down."
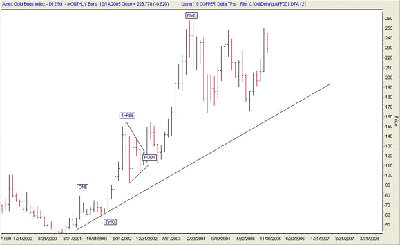
HUI MONTHLY
(click on image
to enlarge)
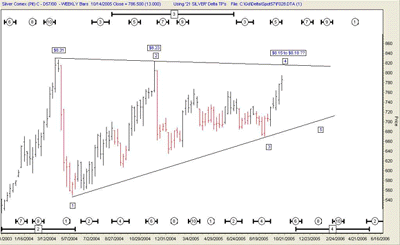
I have written many times that
I consider silver to be a "cantankerous" metal. It
is cantankerous in the sense that its moves can be sudden and
violent. However, the moves do conform to Delta turning points.
That is very much to our benefit. Silver bottomed and started
its bull market in October 2001. This was 6 months after gold
bottomed in April 2001 and started its bull market. It appears
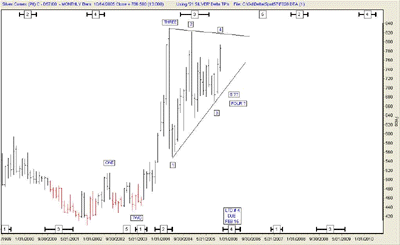
to me that silver is completing a large triangle. I have labeled
the monthly chart showing that silver is still in its first phase
up. The triangle is wave four. Triangles almost always appear
as wave four. Wave five will follow to complete silver's first
phase. Once the first phase is over, a probable drawn out correction
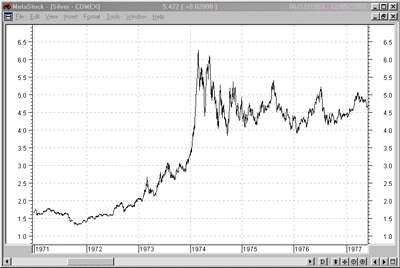
will take place. I have included charts from the 1970s' silver
bull market to show that it appeared to lag behind gold then,
as it appears to be doing now. I compare its 1970s chart to gold's
1970s chart. It is easy to see the different timing by comparing
the two charts.
 SILVER WEEKLY
(click on image
to enlarge)
 SILVER MONTHLY
(click on image to enlarge)
Gold topped in January 1975,
and silver topped in the first quarter of 1974. However the gold
top was an irregular flat that I will discuss in the future.
SILVER 1971 TO 1977
(click on image
to enlarge)
 GOLD 1973 TO 1979
(click on image
to enlarge)

WIDELY FOLLOWED
SILVER STOCKS
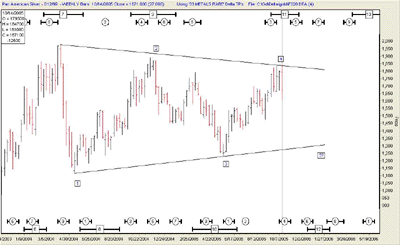
PAAS appears to be
making a 5 wave triangle. Delta Long Term # 12 low gives us a
great clue that the fifth wave of the triangle will bottom at
that time. The long term Delta turning points have delineated
the tops and bottoms of this triangle. LTD numbers 8, 9, 10,
11, and 12 have provided us with the clues that only members,
directors and subscribers to this letter will ever have. They
are absolutely invaluable.
PAAS
(click on image
to enlarge)
Apex silver appears to be in
the process of completing a 5 wave declining wedge. Once again
Delta Long Term numbers 8, 9, 10, 11, and 12 have provided us
with the approximate time of completion of the wedge.
SIL
(click on image
to enlarge)

SSRI appears to be working
on a 5 wave triangle and will most likely bottom approximately
the same time as the other silver shares.
SILVER STANDARD
RESOURCES
(click on image
to enlarge)

I am not certain what CDE s'
corrective formation should be called, but it usually follows
the rest of the silver shares up and down. Lower highs and lower
lows is the best description. It also should bottom at Delta
Long Term # 12 low.
CDE
(click on image
to enlarge)

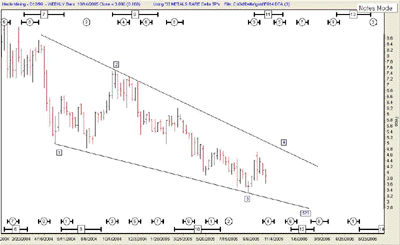
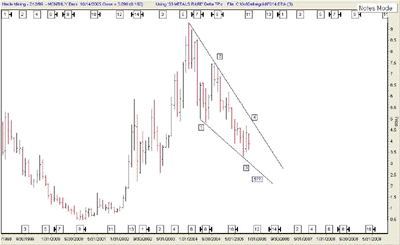
Hecla will be completing a
5 wave declining wedge.
HL WEEKLY
(click on image
to enlarge)
 HL MONTHLY
(click on image
to enlarge)
GOLD AND THE GOLD SHARES
Gold bullion has been
rising in a remarkably steady fashion without any apparent prolonged
corrections. Delta Long Term # 3 high may have arrived late.
Delta Long Term # 4 low is due to bottom in February 2006. Some
kind of a sell off should appear between now and when Delta Long
Term # 4 is due. The gold shares however have experienced a prolonged,
approximate two year corrective period. It does not appear that
the correction is over.
GOLD MONTHLY
(click on image
to enlarge)

The HUI should have one more
wave down and complete the correction at Delta LTD low # 12.
HUI WEEKLY
(click on image
to enlarge)

There is a good probability
that the final fifth wave of the correction in the HUI will go
below the previous two down waves. If it does, the major trend
line of the first phase will be broken to the down side. This
would be normal because each phase usually establishes its own
major trend line. See the descriptions below.
HUI MONTHLY
(click on image
to enlarge)
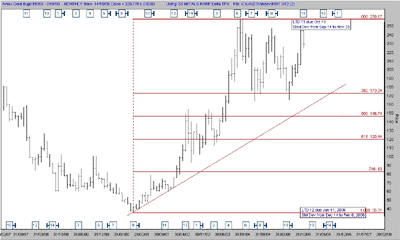
Each down wave of the HUI went
approximately 50 points below the 200 day moving average. If
we have entered a fifth and final wave down it also may go about
50 points below the 200 day moving average. This would bring
the price down to the next obvious support area of 150. If the
150 area is going to be the bottom, it should produce a severe
wash out. Each of the previous two waves down have been accompanied
by a high MACD reading.

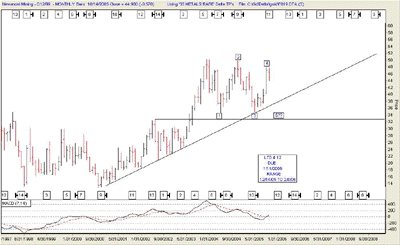
Newmont mining is the premier
gold mining company in the United States, perhaps the world.
It is also in the process of completing wave # 5 down. If the
price goes as low as the previous two waves, NEM will break below
the major rising trend line. This would complete the correction
between the first and second phase.
NEM MONTHLY
(click on image
to enlarge)
If the precious metals complex
completes its corrective process over the next several months
as I have described above, there will most likely be a great
deal of talk about deflation. I imagine the Federal Reserve will
be blamed because they have been raising interest rates and telling
banks that they must tighten their lending requirements. In addition
to that, the new bankruptcy laws will be in effect early next
year and many people will be excluded from wiping out their debts.
Minimum monthly payments on credit card debt will be doubled
from 2 % to 4 % by January 2006. Consumer spending will probably
be curtailed because of these new restrictions. What we will
know, to a very high probability, is that the correction in the
precious metals complex is over amidst the cry of, "Deflation
is here." However, whatever is here early next year will
be what the correction in the precious metals complex has been
discounting for slightly more than two years. Whether there is
deflation or inflation, the precious metals complex should be
ready to move up in the next bullish phase. It will most likely
make the first phase pale by comparison.
I will begin my hypothetical
trading program when the next bull phase starts. The trading
program will be taking advantage of the Delta medium turning
points. They will provide us with multi week trades. If we use
only the long trades, there should be about 5 or 6 trades a year.
There will be 5 or 6 in the gold complex and 5 or 6 in the silver
complex. That will be about 12 multi week trades a year. Each
trade may involve a number of items. I am not inclined to recommend
short sales. They can keep you awake at night.

Stay Well,
Oct 15, 2005
Ron Rosen
email: rrosen5@tampabay.rr.com
Subscriptions
are available at:
www.wilder-concepts.com/rosenletter.aspx
 Disclaimer: The contents of this
letter represent the opinions of Ronald L. Rosen and Alistair
Gilbert. Nothing contained herein is intended as investment
advice or recommendations for specific investment decisions, and
you should not rely on it as such. Ronald L. Rosen and Alistair
Gilbert are not registered investment advisors. Information and
analysis above are derived from sources and using methods believed
to be reliable, but Ronald L. Rosen and Alistair Gilbert cannot
accept responsibility for any trading losses you may incur as
a result of your reliance on this analysis and will not be held
liable for the consequence of reliance upon any opinion or statement
contained herein or any omission. Individuals should consult with
their broker and personal financial advisors before engaging in
any trading activities. Do your own due diligence regarding personal
investment decisions. Disclaimer: The contents of this
letter represent the opinions of Ronald L. Rosen and Alistair
Gilbert. Nothing contained herein is intended as investment
advice or recommendations for specific investment decisions, and
you should not rely on it as such. Ronald L. Rosen and Alistair
Gilbert are not registered investment advisors. Information and
analysis above are derived from sources and using methods believed
to be reliable, but Ronald L. Rosen and Alistair Gilbert cannot
accept responsibility for any trading losses you may incur as
a result of your reliance on this analysis and will not be held
liable for the consequence of reliance upon any opinion or statement
contained herein or any omission. Individuals should consult with
their broker and personal financial advisors before engaging in
any trading activities. Do your own due diligence regarding personal
investment decisions.
The Delta Story
Tee charts reproduced
courtesy of The Delta Society International.
321gold Inc

|