|
|||
Precious Metals Market Timing
|

|
"Curiouser and curiouser!" Cried Alice (she was so much surprised, that for the moment she quite forgot how to speak good English). "Now I'm opening out like the largest telescope that ever was! Good-bye, feet!" (for when she looked down at her feet they seemed to be almost out of sight, they were getting so far off). "Oh, my poor little feet, I wonder who will put on your shoes and stockings for you now, dears? I'm sure I shan't. |
Indeed the gold market, shares and bullion are in a position that I would describe as "Curiouser and Curiouser." The topping gold pattern from 2005 still resembles, to a reasonable degree, the topping gold pattern from 1975.
The eight year gold cycle chart claims that the three year up and five year down cycle in effect since 1976 is now broken. This is true, but that three years up and five years down cycle described the bear market in gold, not the bull market. The chart only goes back to 1976. It has been my contention that the correction in gold that took place in 1975 to 1976 involved an "irregular" flat correction. This means the actual top, for wave counting purposes, occurred at $179.50 in early 1974. I further contend that this cycle began in early 1971 from a period of flat or no movement. This appears on a chart further down showing the flat movement in early 1971. This would mean that the cycle in the 1970's began in early 1971 and topped in early 1974 at $179.50 and not $200 on Jan 1, 1975. That is approximately a three year up period. Gold then bottomed in August of 1976 at $103.50. That would be three years up and a bit more than two years down. From the bottom in August of 1976, a top was made in approximately January of 1980.
The monthly gold chart from 2001 to 2005 shows a wave count that indicates the top was made at $433 and not $458. According to this interpretation, gold has been undergoing an irregular flat correction ever since the top at $433 .This three year cycle began in April 2001at approximately $255 and was complete in April 2004 at approximately $433. If this interpretation is correct, the eventual bottom is due substantially below the recent bottom of $411. According to the long term Delta turning point, a bottom is due in February 2006 with a standard deviation all the way out to July 2006. This potential bottom will most likely break the long term rising trend line. This interpretation is heresy to most gold bugs. If the comments I have received from non subscribers are any indication, it is double heresy!
Is it possible we could bottom in July or August of 2006? Yes, because there is a Long Term Delta # 4 that may bottom all the way out to July 2006. Could we possibly top in January 2010? Yes, because there is a Long Term Delta # 4 due in February 2010.
You see, all of this figuring is really very simple and uncomplicated. That sound you hear is me ducking all the objects thrown, in jest I assume, my way.
There is a chart further down that shows volume and open interest increasing starting with the 1976 bottom. Volume and open interest this time around began to increase in late 2001. It is greater then the bull market of the 1970's. Currently, we may be barely half way through this bull market in Gold. There was no free market in gold until 1975, so it is reasonable that volume and open interest be greater now, perhaps much greater.
Starting with the first HUI chart, explanations will appear with each chart. The conclusion as to what we should do is at the very end. Now come on, don't cheat and go to the end first.
Relatively similar patterns.


click image to see chart


click image to see chart


Volume and open interest are rising since 2001. The next bull phase when it starts should show a large increase in both.

This HUI weekly chart shows the entire correction period since December 2003.
The last eight weeks show slow stochastics making lower highs while price made higher highs. This is a non- confirmation of the higher highs. MACD has been making lower peaks during this entire correction. Momentum is trending down with this latest rise.
The monthly chart of the HUI has corresponding letters showing where the long term Delta turns were supposed to arrive and where they actually arrived. This is as good a road map as there is. I have never seen a better one. LTD # 11 may have arrived this week or will be in shortly. We will then be heading down to LTD # 12.
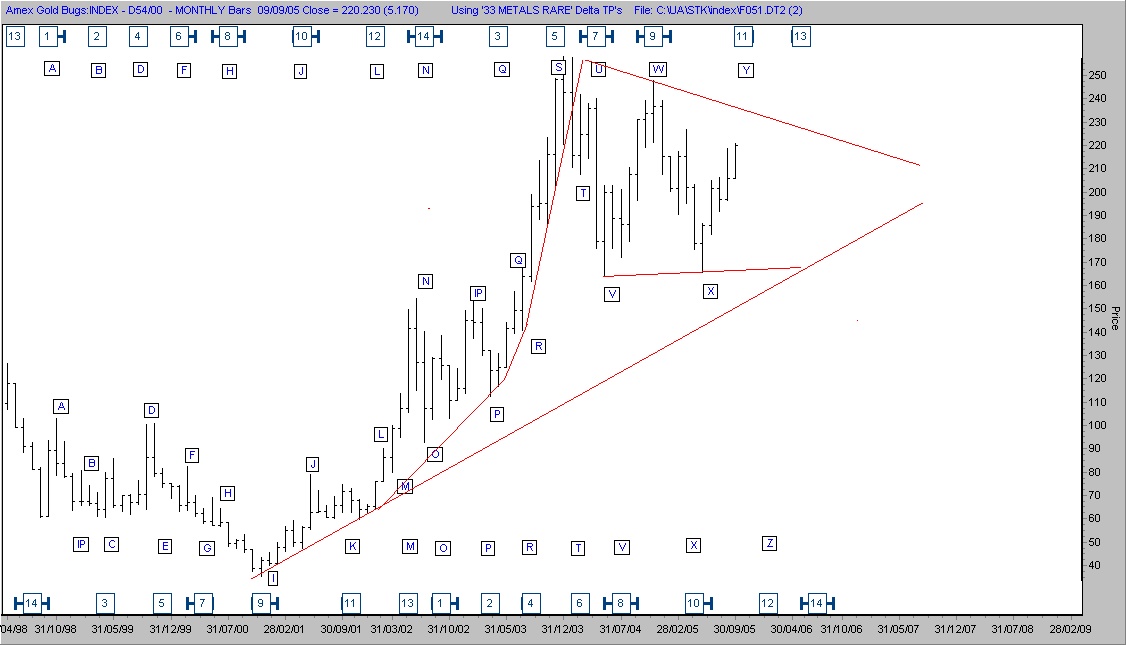
The weekly HUI indicates that medium # 3 high may be in or will be shortly. I am guessing that LTD # 11 will arrive early. Price will then head down to LTD # 12.

The monthly chart of Newmont Mining has corresponding letters showing where the long term Delta turns were supposed to arrive and where they actually arrived. This is as good a road map as there is. I have never seen a better one. LTD # 11 may have arrived this week or will be in shortly.

All of the gold shares have the same turning points as does the HUI. MTD # 3 is easier to see on this weekly chart. Price is in the standard deviation range for arrival.

The XAU /GOLD ratio has definitely broken below its rising trend line, and is having difficulty getting back above it. This is what we should expect during a correction in the gold complex. The shares are supposed to lead the way both up and down. This may be telling us that gold bullion is fated to decline below its major rising trend line.

This report may be a lot of information to digest in one sitting. So, if you have any questions ,post them on the Delta site, and I will do my best to answer them.
After putting all this information on paper I have changed my opinion. I would not enter the gold share market now. I would not buy in thirds as I have previously suggested. I would sit tight and wait either for further corrective action or a break out to new all time highs. The shares may lead the metal higher as they have in the past when the time arrives.
"Time is more important than price; when time is up price will reverse." W.D.Gann
Delta gives us time of arrival. It appears to me that this is not the time for a break out to new highs. If I am wrong, which, of course, is possible we can always get aboard the train at the next stop. If this happens we will have missed the bottom but will know that the move is under way. If we keep repeating the timing of the cycle of the 1970's we will not have a bottom in gold bullion until July or August of 2006. The final decline is usually the most severe. The shares may bottom first and start up for real. That will be our clue that gold bullion will soon follow.
If I am wrong and we miss getting aboard on the first break out to new highs it will be like missing the breakout to new highs in late 1978. Price broke out above $200 and ran up to $250. The first stop was to successfully test the previous high of $200. That's where we would get aboard. Extreme profits developed from that point forward.

Stay Well,
Sep 10, 2005
Ron Rosen
email: rrosen5@tampabay.rr.com
Subscriptions
are available at:
www.wilder-concepts.com/rosenletter.aspx
![]() Disclaimer: The contents of this
letter represent the opinions of Ronald L. Rosen and Alistair
Gilbert. Nothing contained herein is intended as investment
advice or recommendations for specific investment decisions, and
you should not rely on it as such. Ronald L. Rosen and Alistair
Gilbert are not registered investment advisors. Information and
analysis above are derived from sources and using methods believed
to be reliable, but Ronald L. Rosen and Alistair Gilbert cannot
accept responsibility for any trading losses you may incur as
a result of your reliance on this analysis and will not be held
liable for the consequence of reliance upon any opinion or statement
contained herein or any omission. Individuals should consult with
their broker and personal financial advisors before engaging in
any trading activities. Do your own due diligence regarding personal
investment decisions.
Disclaimer: The contents of this
letter represent the opinions of Ronald L. Rosen and Alistair
Gilbert. Nothing contained herein is intended as investment
advice or recommendations for specific investment decisions, and
you should not rely on it as such. Ronald L. Rosen and Alistair
Gilbert are not registered investment advisors. Information and
analysis above are derived from sources and using methods believed
to be reliable, but Ronald L. Rosen and Alistair Gilbert cannot
accept responsibility for any trading losses you may incur as
a result of your reliance on this analysis and will not be held
liable for the consequence of reliance upon any opinion or statement
contained herein or any omission. Individuals should consult with
their broker and personal financial advisors before engaging in
any trading activities. Do your own due diligence regarding personal
investment decisions.
Tee charts reproduced courtesy of The Delta Society International.
321gold Inc
![]()