|
|||
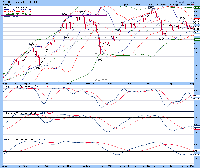
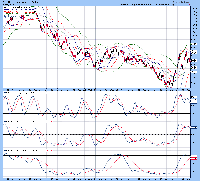
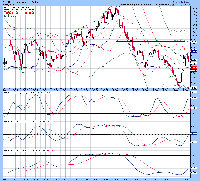
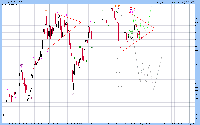
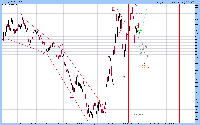
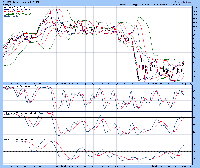
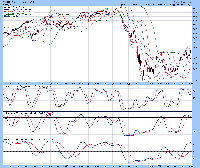
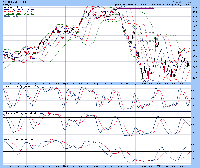
Update of the US Dollar Index, 3 CurrenciesDavid Petch The US Dollar Index has been experiencing weakness over the course of the past few days and is challenging present support levels, which if broken, could see a dip to 82-83. Analysis today will illustrate various trends in the USD and what to expect over the course of the next few weeks. The daily chart of the US Dollar Index is shown below, with upper and lower 21 MA Bollinger bands in close proximity to each other, suggestive that a breakout from the present consolidation pattern is imminent. Full stochastics 1, 2 and 3 are shown below in order of descent, with the %K beneath the %D in stochastics 1 and 3. The short-term and longer-term stochastics are bearish, while mid-term stochastics are trending sideways. A breakout of the consolidation pattern is set to occur, but the daily chart suggests further sideways action until the breakout occurs. A break of the USD below 83.5, followed by 83 sets up the possibility for a decline to the 78-79 level. (Click on images to enlarge) Figure 1 The weekly chart of the USD index is shown below, with upper and lower 21 MA Bollinger bands within range of the index. Full stochastics 1, 2 and 3 are shown below in order of descent, with the %K beneath the %D in stochastics 1 and 2. At present, the weekly chart of the USD has a negative bias, with weakness expected to continue for another 1-2 weeks at a minimum. Figure 2 The monthly chart of the US Dollar Index is shown below, with all three lower Bollinger bands between 68 and 70, indicating strong support in this region. Full stochastics 1, 2 and 3 are shown below in order of descent, with the %K above the %D in all three instances. Based upon the monthly chart, the USD is in a bullish uptrend, even though the daily and weekly charts exhibit weakness. Figure 3 The short-term Elliott Wave of the USD index is shown below, with the thought pattern forming denoted in green and the alternate path denoted in grey. At present, The USD is in threat of breaking beneath a wedge structure that would have a measured move to the 78-80 area before basing. Carefully watch the 83.0 level as mentioned last week, because a close beneath this level would suggest a trip to 78-80 is in the cards. Figure 4 The mid-term Elliott Wave count of the USD index is shown below, with the thought path forming denoted in green and the alternate path denoted in green. Anyone wishing to try and short the USD should wait for a decline below 83, because chances are that a 3-5 point decline would subsequently follow. Figure 5 The daily chart of the Canadian dollar index is shown below, with the Canadian dollar rising above the index. Full stochastics 1, 2 and 3 are shown below in order of descent, with the %K above the %D in all three instances. Based upon positioning of the %K in stochastic 3, the Canadian dollar could continue to rally for another 2-4 weeks before a top is put in place. Figure 6 The daily chart of the Australian dollar Index is shown below, with the index rising to the current level of the index. Full stochastics 1, 2 and 3 are shown below in order of descent, with the %K beneath the %D in stochastics 1 and 2. Given the %K is curling higher in stochastic 1, alongside positioning of the %K in stochastic 3, there is another 2-4 weeks remaining in potential upside to the currency from down under, as per the Canadian dollar, before a top is put in place. Figure 7 The daily chart of the Euro index is shown below, with the index midway between the upper and lower 21 MA Bollinger bands. Full stochastics 1, 2 and 3 are shown below in order of descent, with the %K above the %D in stochastics 1 and 3. Positioning of the %K in stochastics 1 and 3 of the Euro is similar to that of the Aussie dollar, except they are starting at a lower level. Again, the Euro has the potential to run for 2-4 weeks before putting in a top. Figure 8 ### May 2, 2009 |

