|
|||
HUI: Paddled and ShockedDavid Petch
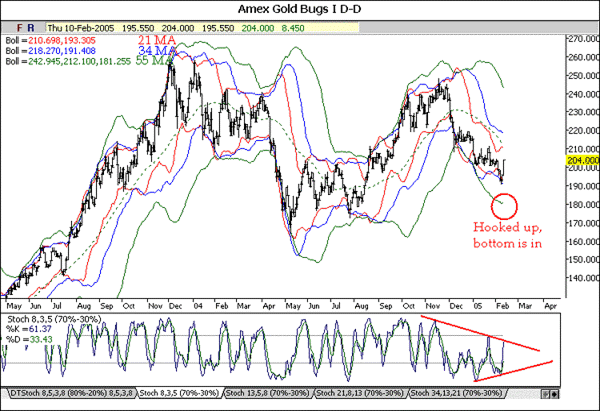
Notice the short-term stochastics with the %K flaring well above the %D. There are two impulsive waves present that are complete as shown in Mondays update. The USD had a key reversal at 85.7ish and broke the trend lines for the zigzag. The USD is likely to have more tricks up its sleeve, so attention must be paid to this. I think that the USD will go test 80-81 again and then bounce up. The pattern has another 1-2 months, maybe more, but with the Elliott Wave count on the dollar, it is in wave [2].c right now so no time or retracement levels have damaged the count. I am not going to present the Elliott Wave count, because that would take away from Monday's read and my discussion, but positions in high quality stocks that have a mine, are in production or are nearing production, have good management, minimal share dilution, safe countries (not Russia, Bema shareholders are going to be killed if Russia blocks their mine), etc. I would avoid pure exploration companies and simply take a list of stocks that have a mine (or are within 12-18 months of opening one) and see which ones have held up relatively good compared to the dogs. Certain stocks come to mind that have done well. The coming advance should see these things leap well above the pack. Some small speculative stocks have been crushed. Look for breakout volume on key stocks for entry, that way your money is not dead for a longer period of time. The HUI having a big volume reversal with no capitulation is rather worry some in some regards, because there was no capitulation. This is a corrective phase though and likely not the end based upon no final volume. So, I have to stick with scenario i) or ii) for now. The high quality stocks have had minimal downside during this correction, even some going up, so pick'em carefully. By the way, the HUI appears to have a good setup for a minimal 2-3 month rally, but core positions should be held at all times. One little micro oil sand stock I discovered during research for a course called Technology Commercialization Management I is up 100% off the lows. This stock has high quality management and is up on heavy volume. All Canadian oil sand stocks are going to be equivalent to Uranium stocks in the coming decade (avoid Argentinean oil sand stocks, as Chevez is likely to divert that to China). Diversification into oil, Uranium, coal, biofuels (Boralex on the TSE), gold and silver is mandatory for a well-diversified portfolio. Figure 1 Have a good weekend. February 11th, 2005 Disclaimer: The above is a matter
of opinion and is not intended as investment advice. Information
and analysis above are derived from sources and utilizing methods
believed reliable, but we cannot accept responsibility for any
trading losses you may incur as a result of this analysis. Comments
within the text should not be construed as specific recommendations
to buy or sell securities. Individuals should consult with their
broker and personal financial advisors before engaging in any
trading activities. Do your own due diligence regarding personal
investment decisions. |


