Chart In Focus
Yen Spikes On Carry Trade Meltdown
McClellan Financial Publications, Inc
Posted Aug 23, 2024
Aug 16, 2024
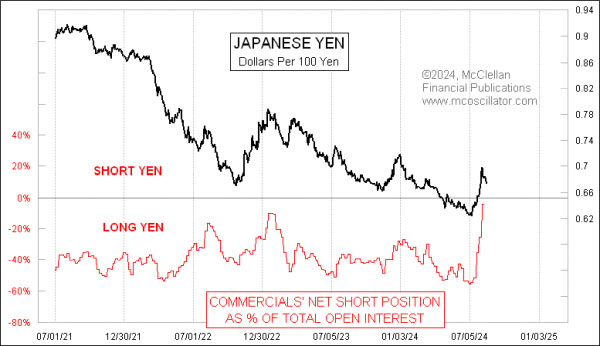
The Bank of Japan raised its key interest rate target on July 31, 2024 from 0.1% to 0.25%. That is an empirically tiny raise, but it caused earthquakes around the globe because of what it did to players in the financial markets. And that brought about a big shift in the Commitment of Traders (COT) Report data, as seen in this week's chart.
Having the BoJ raise its short-term rate meant that borrowing money from banks in yen immediately got just a little bit more expensive. And it also meant that if you are holding yen, you could suddenly earn just a tiny bit more interest on your money. It might not seem like such a small rate hike should matter so much, but when traders employ leverage to engage in the "yen carry trade", then a small change in interest rates can start to matter a whole lot more.
The yen carry trade is a term referring to the practice of borrowing money in yen, which you then exchange for another currency in order to earn a higher interest rate. If you only have to pay less than 1% on the yen you borrowed, but you can go earn 5% in dollars, that's a pretty good deal. And it can be an even better deal if you are able to pay back your yen loan using depreciated yen thanks to that currency falling in value. Someone doing this trade is "short" the yen, which is great as long as the yen is falling, and the price of the interest is low.
But that good deal only works until somebody changes the terms, like having the borrowing price of the yen go up, or having the value of the yen start to rise. Then suddenly your great trade starts working against you, and against everyone else playing that game. The rush for the exits can become a stampede, which exacerbates the traders' problems even more. And that is how we got the sharp rise in the yen in early August, as well as the sharp selloff in global stock prices.
Traders who had adverse positions in the yen carry trade quickly learned about the old Wall Street saying, "If you can't sell what you want, then sell what you can," in order to meet your margin calls.
All of that is just interesting background for what this week's chart is about. The weekly COT Report details traders' positions in over 200 different types of futures contracts, including the Japanese yen futures. The "commercial" traders are the big money, ones who use the subject commodity or investment instrument in their trade or business. They are usually considered the "smart money", especially when they get to a large skewed position.
The commercial traders of Japanese yen futures have been continuously net short to varying degrees for several years, even as the value of the yen has fallen. That might seem to go against the whole principle of these traders supposedly being the smart money, but the story is deeper than that. Most of the commercial traders of Japanese yen futures are big banks who are using the futures markets to hedge their deposit and lending risks, using sophisticated pairings of multiple investment instruments. So it is not so much a case of them making a pure directional bet.
The reaction to the early August blowup in the yen carry trade was that the commercial traders started rapidly abandoning their once-big net long position in the yen. That position paid off well for them (finally), and they harvested those gains and moved to a more neutral position. Just by getting up close to neutral, these traders effectively moved to their biggest bet against appreciation in the yen in several years, which carries a message that the blowoff move in prices is probably over.
Here is a longer-term look at that same comparison:
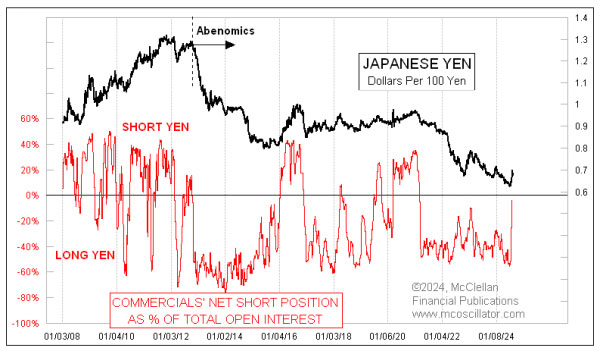
You can see that there was a similar period back in 2012-2015 when the commercial traders held a big net long position in the yen even as the value of the yen was in a persistent downtrend. That was a period after then Prime Minister Abe started a set of economic reforms which came to be known as "Abenomics". The rules for interpreting these COT Report data are different, it seems, during protracted downtrends.
That 2012-15 downtrend in the value of the Japanese yen ended in mid-2015, and that end point was signaled by a big change in the commercial traders' net positions. They spiked back up towards neutral, much like this most recent spike, signaling that something was changing in a big way. The implication is that the yen is now starting the process of transitioning out of its long downtrend which started in late 2020. That does not necessarily mean an uptrend has to be starting, though. We could see several months or even longer of sideways behavior before a real uptrend begins. But something big has just changed in that market.
***
Related Charts
###
Tom McClellan
Editor,
The
McClellan Market Report
email:
tom@mcoscillator.com
website:
www.mcoscillator.com
(253) 581-4889
Subscribe
to Tom McClellan's free weekly Chart In Focus email.
Copyright ©1996-2024, McClellan Financial Publications. All Rights Reserved.
321gold
Ltd

|