Chart In Focus
Sunspot Cycle Shows a Big Upturn for Unemployment
McClellan Financial Publications, Inc
Posted Aug 01, 2024
Jul 25, 2024
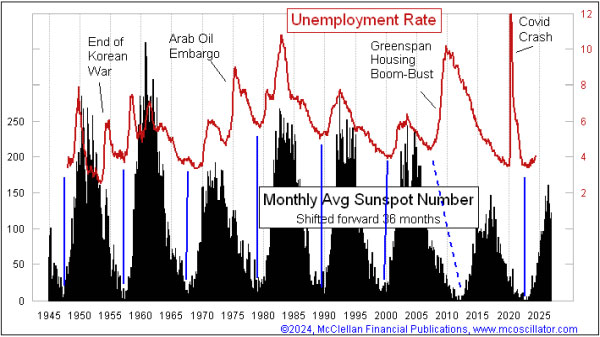
A lot of people are going to resist accepting the message of this week's chart, but I am going to show it anyway. There is a strong positive correlation between the US unemployment rate and the monthly sunspot count. The trick is that I am using a 36-month forward offset in the chart above to help us see that relationship.
We only have reliable data on the unemployment rate (U-3) going back to 1947. There are some other unofficial data sources which have attempted to quantify unemployment rates going farther back, but the Bureau of Labor Statistics (BLS) did not start tabulating these data until 1947. It is interesting that the government statisticians waited until after all of the post-WWII layoffs were done, and people were getting back to work again, to commence that data reporting.
The sunspot cycle lasts on average 10.6 years, and that has been pretty regular going all the way back to the invention of reliable telescopes back in the 1700s. During this period that we have these data on the unemployment rate, the sunspot minimum has pretty reliably brought a bottom for the unemployment rate about 3 years later. Please note the 3-year time offset of the two plots in the chart above.
There was one instance when this relationship got significantly disrupted. The collapse of Greenspan's housing bubble starting in 2005 arguably pulled forward the low point for the unemployment rate by a few years. Other big geopolitical events like wars and the Arab Oil Embargo have also caused more minor disruptions along the way. And just recently, the Covid spike in unemployment was not part of the program. The relationship seems to be falling back into its normal rhythm since then.
It is natural for anyone seeing this relationship to wonder about why it could possibly happen. I do not have a good answer to that question, other than to note that I have previously reported on the weak positive correlation between sunspot numbers and the stock market. See here.
I have also noticed that sunspot numbers do have a lot of influence on several climate data series. Global hurricane counts, for example, are negatively correlated with sunspot numbers. So the coming drop off in sunspot counts en route to the next solar minimum should mean that we will see a natural rise in global hurricane (and typhoon) counts over the next few years. Sunspots are also negatively correlated to something called the Pacific Decadal Oscillation (PDO).
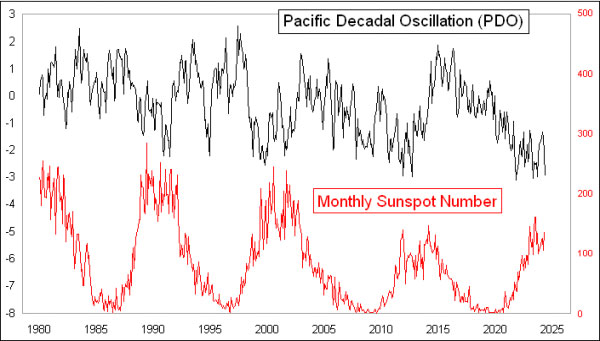
The PDO is a reflection of sea surface temperature anomalies in the Pacific Ocean, and it is tied to the better known El Niño/Southern Oscillation (ENSO) cycle. Changes in the PDO are very strongly correlated with several climate phenomenon, such as rainfall where I live in the Pacific Northwet (sic). The low PDO numbers in recent years explain the persistently below normal rainfall totals we have been having.
How that relates to the unemployment rate is a lot harder to tease out of the data, and I don't have a satisfying answer to explain the linkage. What I do have is almost 80 years of the relationship working for the most part, and so at some point we can just accept the legitimacy of a phenomenon, even if we cannot fully explain that phenomenon.
Other factors will also affect the unemployment rate going forward, perhaps exacerbating or dampening changes which the sunspot cycle says should be happening anyway. And humans are probably not done having wars and other international conflicts which may affect the unemployment rate episodically. So we are not likely to see perfect correlation between the sunspot numbers and the unemployment data. But it seems very likely that we are going to be seeing an upward trend for the unemployment data for the next few years, which will be unfortunate for whoever gets elected in November and gets blamed for that rise in joblessness by the press.
***
Related Charts
###
Tom McClellan
Editor,
The
McClellan Market Report
email:
tom@mcoscillator.com
website:
www.mcoscillator.com
(253) 581-4889
Subscribe
to Tom McClellan's free weekly Chart In Focus email.
Copyright ©1996-2024, McClellan Financial Publications. All Rights Reserved.
321gold
Ltd

|