|
|||
We're watching the noseClive Maund Gold
Gold has had a good rally so far this month, following a potentially bearish breakdown from the large symmetrical triangle that formed from last December and which was followed by an (admittedly marginal) break of its long-term uptrend. Due to the possible bearish ramifications of these trendline breaks we have refrained from an all-out "buy alert" on gold stocks. Now, however, gold has risen to a critical level where it is running into resistance from the top of its wedge down channel, and a little above that, the underside of the triangle (see 1-year chart). The triangle is rapidly narrowing down to a point and, in any event, we will want to see the gold price break above the nose of the triangle, currently at $438, before turning outright bullish. Turning outright bullish once that happens makes a lot of sense, as close stops can then be placed beneath the nose of the triangle, affording a very favourable risk/reward ratio.
As gold has performed well this month even though the dollar has risen, it follows that it must have performed even better against the Euro. Looking at a 5-year chart for gold against the Euro, we can see that this has indeed been the case, with gold spiking upwards towards what is clearly important resistance approaching 3.60, that has beaten gold back 4 times since early 2002. It is running into this resistance synchronously with the dollar resistance, thus we are now are a very important juncture. If gold breaks out against the Euro it will be a very bullish development.
The latest COTs charts show the commercials' short positions in gold starting to climb, but they are by no means at critical levels yet.
The dollar succeeded in pushing still higher on Friday, and it is still expected to back off short-term as it is overbought and in a zone of heavy resistance, shown on the 2-year chart. However, there can be no denying that the dollar has now broken out of its long-term downtrend, shown on the 4-year chart. This is why it makes sense to tread carefully until gold succeeds in breaking above the apex of the triangle described above.
The critical juncture at which gold now finds itself is mirrored by silver, where we are seeing an ominous increase in the commercial short position, which gives additional grounds for caution with gold itself at this juncture. Silver
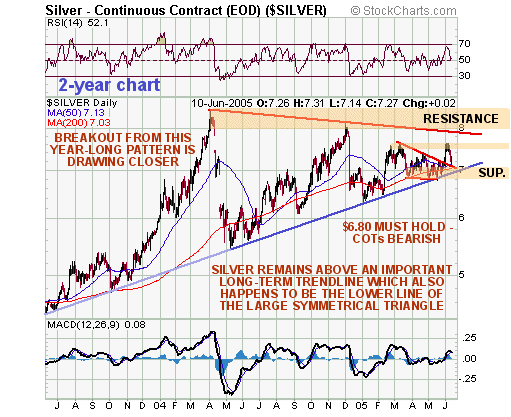
The 2-year chart reveals that silver is still within the confines of a very large symmetrical triangle pattern, whose lower boundary, when extended is also a long-term uptrend line. It is clear from this chart that a resolution of this standoff, a breakout one way or the other, is fast approaching.
When silver broke sharply higher at the end of May it had looked like it would swiftly run to the upper boundary of the large triangle towards $8. Instead, it stalled out at the March high, and the Commercial short position ramped up, indicating a probable retreat, which is what we saw last week. It had been expected that the Commercial short position would shrink on this decline, but, as we can see on the latest COT chart below, it has not - it has done the opposite. This is viewed as an ominous development that greatly increases the risk of a breakdown from the large triangle. Such a development would be expected to tally with gold failing to overcome its triangle apex resistance (see Gold Market update, above) and going into retreat.
Any subscribers who acted on the "Silver Stocks buy spot" article posted on the site just before the low on Thursday morning may have benefited when silver stocks ramped yesterday, with some of the larger issues gaining about 5%. In the light of these latest COT figures, however, it is considered wise to tighten stops/trim some holdings. There is one further possibility that should be mentioned. Quite often, when prices get forced into the apex of a triangle, as we are seeing now with silver, an upside breakout aborts, leading to what is called an "end run about the line" - prices advance for a while and then arc round and plunge through the nose of the triangle and go into a severe decline. The way to guard against the worst effects of this, if we see an upside breakout, is to automatically exit holdings if silver subsequently breaks below the apex of the triangle. 11 June, 2005 Clive Maund
is an English technical analyst, holding a diploma from the Society
of Technical Analysts, Cambridge, England. He lives in Chile. Copyright ©2003-2011 CliveMaund. All Rights Reserved. Charts courtesy of StockCharts.com. |


