 Special SKI Report #279 Special SKI Report #279
SKI’s Explanation for the Rise Jeffrey M. Kern, Ph.D.
Email: jeff@skigoldstocks.com
USERX | historicals
Written Sunday Nov 13, 2022
Published Nov 14, 2022 Current USERX price = 9.60, Up 99 cents (10.6%) since the last report 3 weeks ago. Introduction (repeated from prior Reports):
I have been using my unique SKI indices
to predict price changes in the precious metals' market for more
than two decades. And my indices continue to mark the critical
points. I have initiated a subscription website since 1/13/06
(yes, Friday the 13th) after having posted free updates for years
at www.321gold.com. SKI is a timing service; although
almost everyone seems to believe that market timing is impossible,
that IS what the SKI indices have done for 36 years.
The SKI indices contain short-term (16-20
trading days), intermediate-term (35-39 trading days), and long-term
(92-96 trading days) indices. A more comprehensive description
of these mathematical indices and their history is found here.
Basically, the indices compare today's price to prices from a
specified prior time period. The name of the index specifies the
time period (e.g., 92-96 index = compare today's price to prices
from 96, 95, 94, 93, and 92 trading days earlier). Although I
use the oldest gold mutual fund, USERX, for analyses, the predictions
are applicable to the broad precious metals' market. I do not
recommend or analyze specific stocks, but my subscribers from
around the world regularly discuss individual issues on our Forum.
In addition to the truly unique SKI indices, I also use "run
patterns" to guesstimate turning points in the precious metals'
market. A "run" refers to a pattern of daily up and
down market closing prices. If the market has 3 consecutive days
of higher closing prices, the run is "3 up". If prices
then decline for 2 consecutive days, the run becomes "3 up
and 2 down". If prices then close higher the next day, the
run changes to "2 down and 1 up". Some people have referred
to run patterns as "worms". A run pattern is only completed
after the direction of closing prices has changed. I have compiled
a listing of every run pattern that has ever occurred and generated
probabilities that the end of the run marks a high or a low, moderated
by the indices themselves. New Material
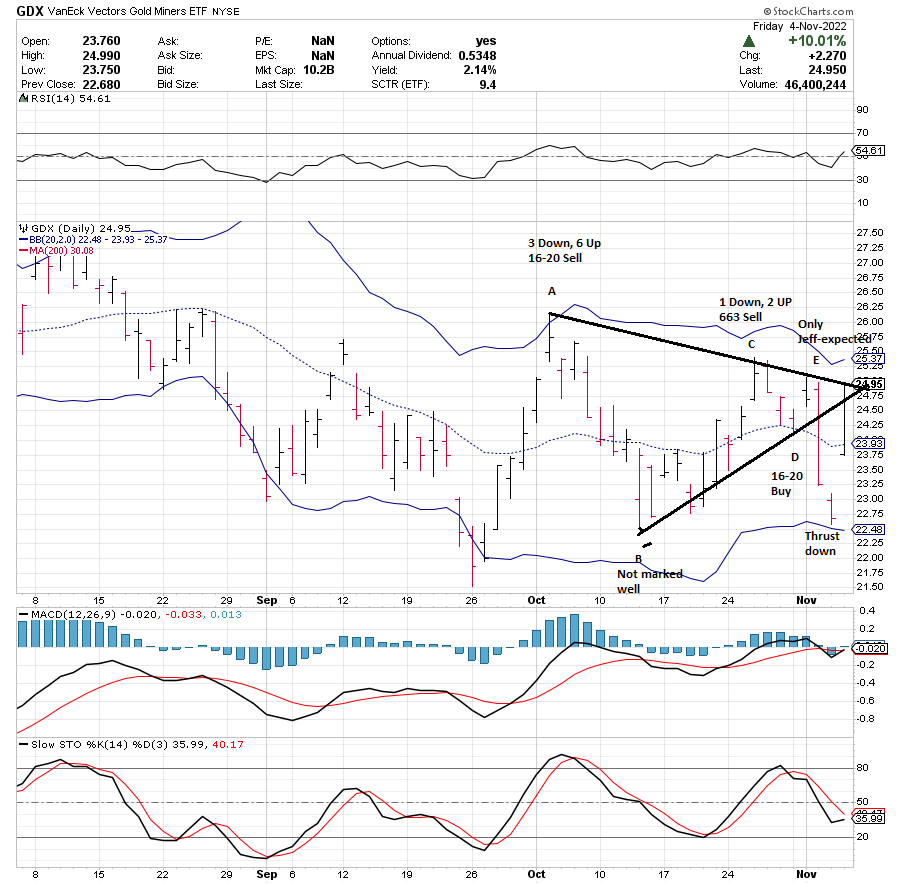
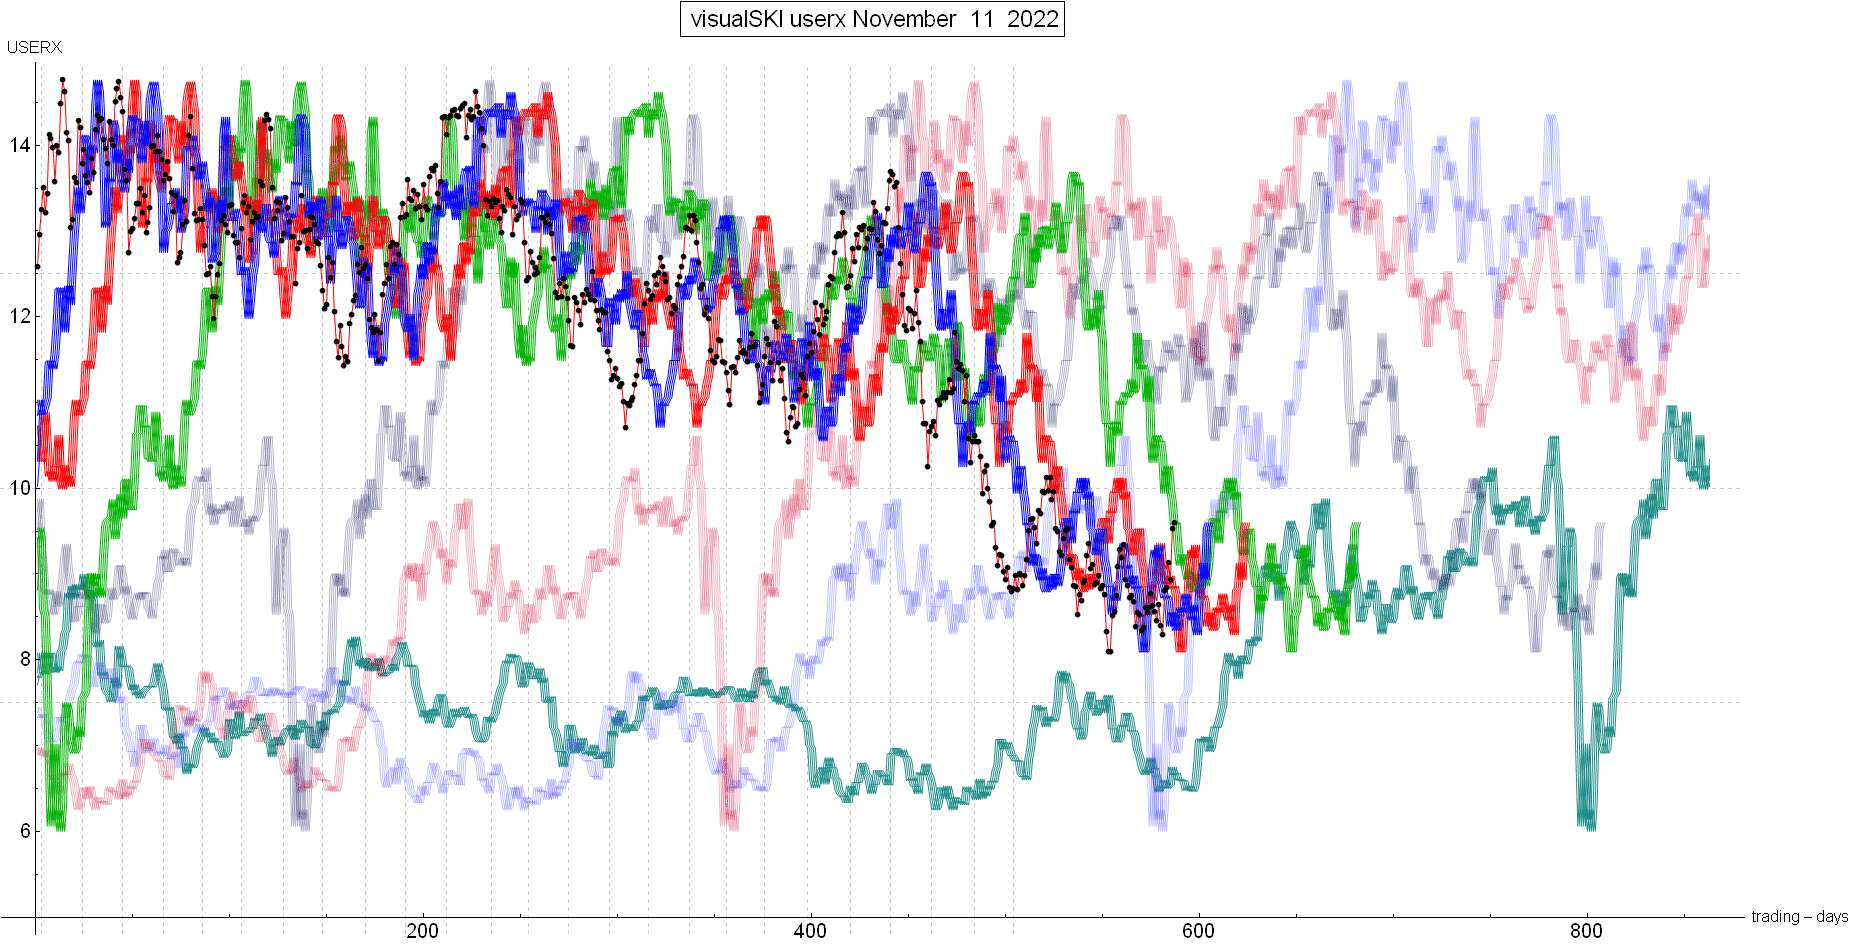
The last SKI Report, written on 10/23/22, was looking bullishly, but a specific behavior was needed to maintain that bullishness: “So, SKI and the bulls need at least about a further approximate 8% rise during the next about 8 trading days. Chartists would/will say that USERX needs to “break out” above the neckline of the potential Head @ Shoulders bottom pattern. SKI should/will mark that break-out or a failure if the rise doesn’t continue AND continue quickly enough to stay above the 16-20 and 35-39 indices”. The gold stocks did rise for 3 trading days. USERX declined on 10/24/22 and then rose for 2 trading days, from 8.55 to 8.77. That formed a bearish 1 Down and 2 UP run pattern into a first resistance 16-20 index sell signal. And USERX could not rise enough to stay above the red line 35-39 index. Therefore, that was likely to be a short-term high. It was. The ensuing 3-day decline yielded a supportive 16-20 index buy signal on 10/31/22 at USERX 8.42. The index pattern and the run pattern allowed Jeff to perceive that a 1-month A-B-C-D-E “contracting triangle” was forming. The A-Up was, if you remember, that powerful 3 Down and 6 Up run pattern from 9/26/22 to 10/04/22. That run pattern had a 77% probability of marking a high (as previously reported) at USERX 9.28. And it did mark a high. B-Down was into 10/19/22 at USERX 8.34. C-Up was the brief rise into 10/26/22 as USERX’s long-term 663 index executed a resistance sell signal at 8.77. And then the brief decline into 10/31/22 executed a quick supportive 16-20 index buy signal for the D-Wave down. The pattern was supposed to yield a final little E-Wave Up and then a collapse. The E-Wave higher was into the 11/02/22 U.S. Federal Reserve meeting. And then the risk assets collapsed. The important feature of the “contracting triangle” is that when the thrust down occurs, Elliott Wave Theory projects that it is the FINAL THRUST down. The caveat is that one can’t be sure whether such a thrust will be brief (several days) or more extended (over weeks). The “contracting triangle” was the technical “reason” for the brief collapse after the last Federal Reserve announcement and the subsequent “explosion” higher. Here’s GDX’s labeled triangle chart as of one day after the “final” low on 11/03/22 at USERX 8.29: see chart here. It had risen 10% in one day to the upper boundary of that contracting triangle. The corresponding chart for the HUI showed that it had only risen to the bottom line of the triangle. BUT USERX HAD SOARED BACK ABOVE ITS CONTRACTING TRIANGLE FOR LIKELY BULLISHNESS ON 11/03/22 AT 8.81. As I often mention, it pays to track the Australian gold stocks (XGD.ax) index because 10-12% of USERX’s holdings are invested in Australia. The index had formed a rather perfect potential Head@Shoulders chart bottoming pattern (not a triangle). After the North American gold stocks declined on 11/03/22 to their potential low, the Australians actually held and ROSE a little. When USERX soared the next day, the Australians were poised to bullishly break-out of their H@S pattern on Sunday night (11/07/22). Here’s that perfect H@Shoulders chart that Jeff tracks. I’ve got a lot of Australian SKIers. When the Aussies bullishly broke out on 11/07/22, Jeff advised buying last Monday, Tuesday, and Wednesday for my largest long position of the year. I don’t spend all this time and patience to take small positions. I measure them in terms of my net worth (now 22% long gold stocks, not counting physical gold). The powerful rise went back above the red line 16-20 index last Tuesday (11/08/22) for a first resistance 16-20 index sell signal. The rise was then SKI-supposed to continue to above the 2nd resistance red line 35-39 index. And so it did, with that resistance signal executing on this past Friday (11/11/22) at USERX 9.60. Such resistance may yield a brief decline, but the most important SKI-index is the green line master 92-96 index. Look at the SKI chart. Look at how USERX has risen to exactly reach the master 92-96 index’s green 3rd resistance line. Now, you should easily see that the green 92-96 index line (the index’s back prices) is plunging. If/When USEX soon rises to above that line it’ll reach 3rd resistance. THIS IS NOT YET A SKI BULL MARKET. A SKI bull requires a rise to above the green line, then a decline back below it, and then a rise back above it (ala January 2016, March 2020, and most of the other bull markets since 1974). Yes, it’s possible that the gold stocks will just continue to rise over weeks without a real correction, but that would be a major BEAR market rally. The real bull appears to “SKI-need” a correction into mid-December to go back below the 92-96 index (probably as that green line rises back up to USERX $10) and then a quick rise back above the index’s line as that green line plunges again. Look again at that chart…. Jeff’s expecting to take some profit (soon; reserved for SKIers) on a rise to the 3rd resistance 92-96 index’s “buy” signal and then look for a decline to set-up a REAL SKI-BULL. The Australian chart of its gold charts is approaching the upside target for its Head@Shoulders bottom pattern (i.e, the distance from the Head and each Shoulder, added to the Shoulder’s price of 5000). A real SKI bull market yields 100-500% rises and Jeff will personally take a 40% net worth long position. I strongly urge/encourage you to subscribe to “see” and act upon the approaching outcomes. This is “big-time” and Jeff strongly tries to avoid “hype”…. Best Wishes, Jeff If you are interested in following and learning more about the SKI indices, I'll write another Report in three weeks or you can shell out the big bucks for a SKI subscription. Weekly Updates are available by subscribing for a month (or longer if you're wise and cheap enough to want to save money) at my website www.skigoldstocks.com for the princely sum of $30 (for a one month subscription) or more ($240 for an annual subscription). I also provide more frequent intra-week daily messages/alerts at a slightly higher price along with access to our informative Forum. ###  SKI archives SKI archives
email: jeff@skigoldstocks.com
Jeffrey M. Kern,Ph.D., is an academic psychologist with a specialty in the measurement and prediction of human behavior. The communications provided are for informational purposes only and are not intended to be investment advice or recommendations for specific investment decisions. Dr. Kern is not a registered investment advisor, but is registered as a commodity trading advisor (CTA). The information provided is considered accurate, but cannot be guaranteed. Investments/trading in narrow market segments or gold futures is for individuals willing to accept a higher level of risk for the opportunity of greater returns. Past performance is no guarantee of future performance. His website is www.skigoldstocks.com.
Communications should be sent to: jeff@skigoldstocks.com.
Copyright © 2002-2024 Jeffrey Kern. All Rights Reserved.
321gold Ltd

| 