 Special SKI Report #251 Special SKI Report #251
Gold Stock Update: Mechanical SKI Activated Jeffrey M. Kern, Ph.D.
Email: jeff@skigoldstocks.com
USERX | historicals
Written Sunday Mar 28, 2021
Published Mar 29, 2021 Current USERX price = 12.08, Up 54 cents (4.7%) since the last report 3 weeks ago. Introduction (repeated from prior Reports):
I have been using my unique SKI indices
to predict price changes in the precious metals' market for more
than two decades. And my indices continue to mark the critical
points. I have initiated a subscription website since 1/13/06
(yes, Friday the 13th) after having posted free updates for years
at www.321gold.com. SKI is a timing service; although
almost everyone seems to believe that market timing is impossible,
that IS what the SKI indices have done for 36 years.
The SKI indices contain short-term (16-20
trading days), intermediate-term (35-39 trading days), and long-term
(92-96 trading days) indices. A more comprehensive description
of these mathematical indices and their history is found here.
Basically, the indices compare today's price to prices from a
specified prior time period. The name of the index specifies the
time period (e.g., 92-96 index = compare today's price to prices
from 96, 95, 94, 93, and 92 trading days earlier). Although I
use the oldest gold mutual fund, USERX, for analyses, the predictions
are applicable to the broad precious metals' market. I do not
recommend or analyze specific stocks, but my subscribers from
around the world regularly discuss individual issues on our Forum.
In addition to the truly unique SKI indices, I also use "run
patterns" to guesstimate turning points in the precious metals'
market. A "run" refers to a pattern of daily up and
down market closing prices. If the market has 3 consecutive days
of higher closing prices, the run is "3 up". If prices
then decline for 2 consecutive days, the run becomes "3 up
and 2 down". If prices then close higher the next day, the
run changes to "2 down and 1 up". Some people have referred
to run patterns as "worms". A run pattern is only completed
after the direction of closing prices has changed. I have compiled
a listing of every run pattern that has ever occurred and generated
probabilities that the end of the run marks a high or a low, moderated
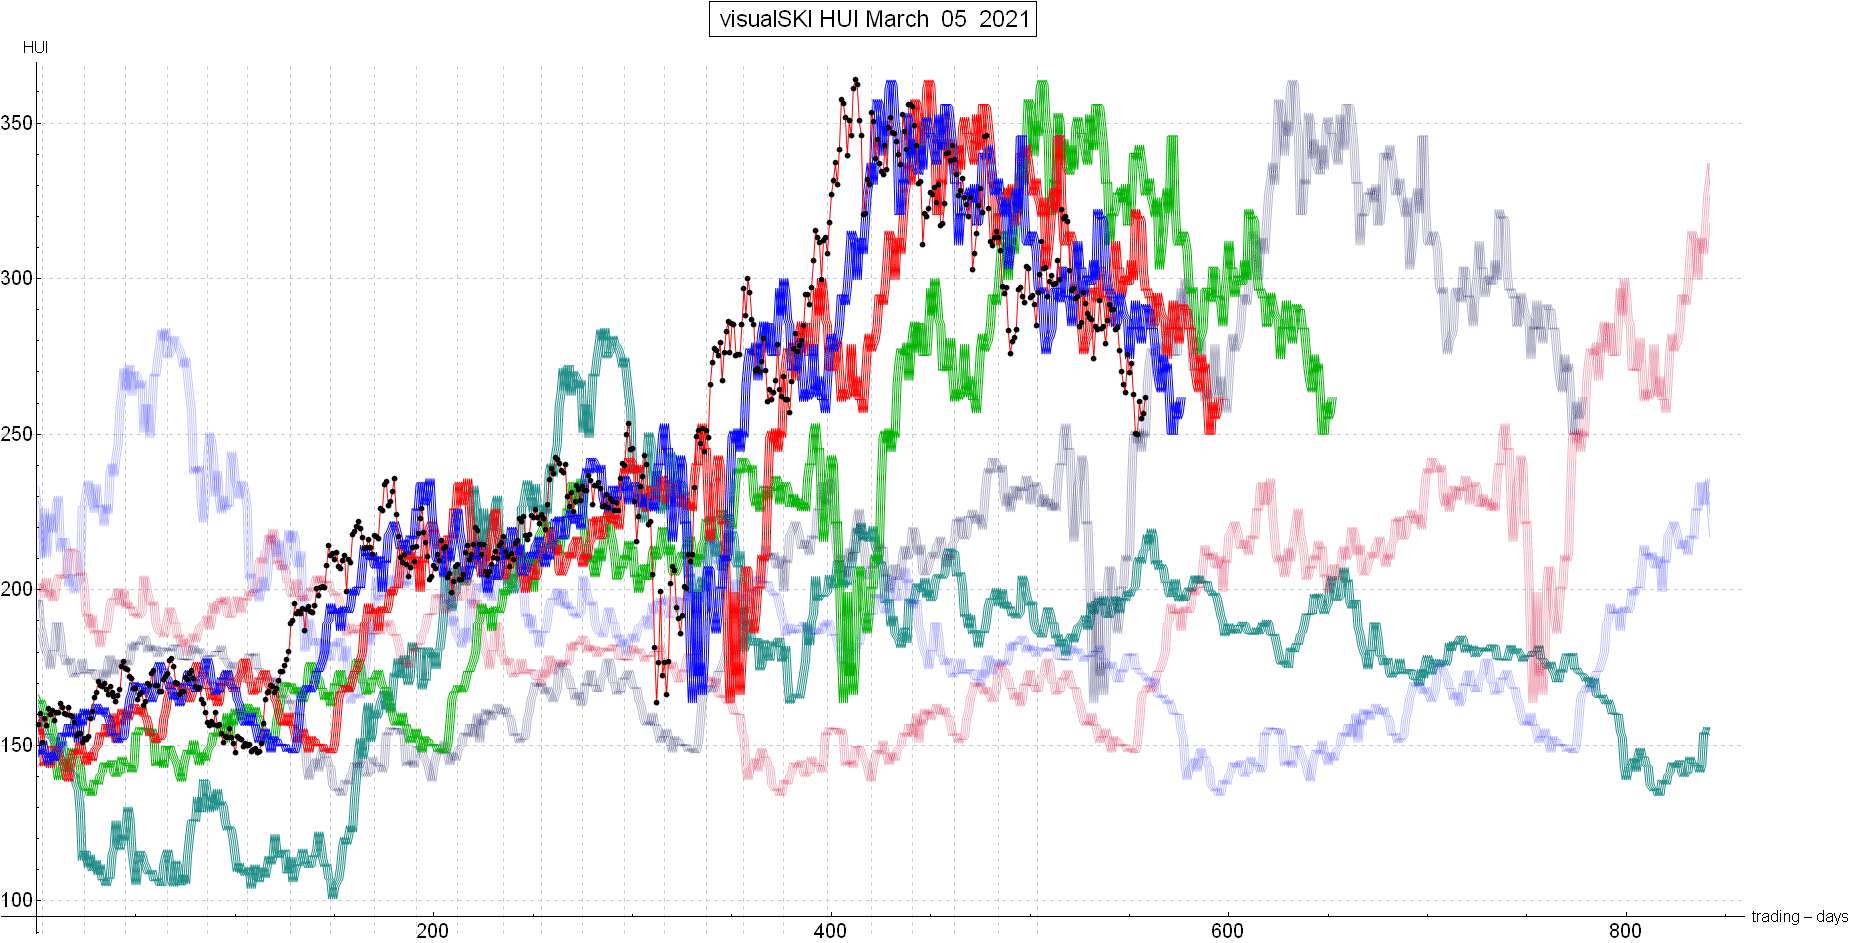
by the indices themselves. New Material The last SKI Report, written on 3/07/21, had just turned to short-term BULLISHNESS based upon the HUI. The HUI had declined to exactly hit/touch its long-term 221 index at 250.16. Although the primary SKI dependent measure is USERX, the auxiliary HUI had hit the long-term supportive 221 index as portrayed in the HUI’s SKI chart with the black dots being the HUI’s current price and the rising purple line being the 221 index. The Report concluded that “The HUI’s expected short-term rise must be expected to fail in perhaps a week on a rise (we see) for further bearishness”. The Report was trying to convey that the short-term was bullish but that a rise was expected to yield one more decline that might yield THE capitulation low. That short-term bullish expectation was correct. Gold and USERX dropped some more on Monday (3/01/21) as risk-taker SKIers were buying, but the HUI still held at 250.00 for its absolute closing low. The ensuing rise wasn’t strong enough to stay above that HUI SKI-chart’s rising 221 index. Therefore, the HUI’s 221 index bearishly sold on 3/11/21 at 270.04 and safety dictated selling there for a short-term 7.9% gain on the HUI. That was despite USERX continuing to look short-term bullish. The missed further rise was the standard/classic rise into the HUI’s and USERX’s first RESISTANCE 16-20 index sell signals that generated on the 3/17/21 U.S. Federal Reserve day’s spike up to USERX 12.81. That means that the sell signal generated on the day of that high but executed the next day, one day late (common) The first resistance 16-20 index’s sell signal ACTIVATED Mechanical SKI. The rise had also done the typical simultaneous hit/touch of the resistance 35-39 and 92-96 indices. That meant that Mechanical SKI would buy on a decline to below the prices from 16-20 trading days earlier OR that prices would rise a little more into actual 35-39 and/or 92-96 index “buy” signals for a more significant TOP. That potential decline OR brief further rise was 100% for certain because it was pure math: One or the other WAS (100%) going to occur. And the HUI’s 221 index generated a buy signal right there, but it was obvious that it was about to sell again because the index’s back prices were rocketing higher. Therefore, buying was absolutely discouraged as SKI + Jeff remained in cash from 3/11/21. But no, Jeff did not go short because I am conservative and “risk-averse”. Last week’s ensuing decline DID go down just barely enough to generate the USERX 16-20 index’s buy signal on Wednesday (3/24/21) for execution on Thursday’s close (3/25/21) at HUI 362.56 and USERX 11.82. The SKI research was based upon the desire to generate buy or sell signals one day ahead of their execution. That would always provide a 1-day advance notice to act (buy or sell). Therefore, we supposedly didn't need to watch the market and could just execute. THAT IS EASIER SAID THAN DONE! SKI-success requires the most difficult “self-discipline”, over and over and over….. Nonetheless, Mechanical SKI bought on 3/25/21 at USERX 11.82. Now, Thursday’s (3/25/21) 16-20 index buy signal at USERX 11.82 and HUI 262.56 yielded the normal instant rise on Friday, but that was enough to quickly generate a 16-20 index sell signal that executes tomorrow (3/29/21). Therefore, the safe thing to do is to complete the short-term trade and sell on Monday (3/29/21). We again know (100%) that the gold stocks will then either go down to another 16-20 index buy signal (for a low) OR the gold stocks will rise to the 35-39 and/or 92-96 indices at around USERX $13 for some type of next top. No crystal ball, but Jeff “hopes” for the beautiful buy on a decline. The time for that is running out and that provides important forthcoming information. It is totally possible that THE multi-month corrective below occurred 2.5 weeks ago at USERX 11.43 and that prices will rise past Monday’s (3/29/21) 16-20 index sell signal. But safety sells on Monday AND a subsequent decline/plunge should then be THE capitulation low. USERX’s SKI-chart purple line 221 index is rising to top here at 10.69 – 10.96. It would take a “wah-out” decline to go below this long-term master index. A decline to sell the 221 index (as the HUI has done) and then a quick re-buy (on a rise) would be another buy-point. Six weeks ago, I wrote to not yet subscribe, and folks subscribed. Three weeks ago, I wrote that a low was here, but one more capitulation was expected after a rise. If the gold stocks plunge after Monday, Jeff issues THE subscribe notice for next weekend (a 3-day holiday weekend in the U.S.). No, I never offer “special price discounts” to new SKIers because that’s not fair to current SKIers and it’s an advertiser-type “come-on”. A rise on Monday (3/29/21) and then a plunge should (“will”) yield THE corrective low from the August 2020 top and an expected V-shaped strong rise for the gold stocks. SKI usually buys within one trading day of such lows. BUT again, there cannot be any guarantee for that “desired” capitulation. The alternative is the rise to the USERX prices from 35-39 and/or 92-96 trading days earlier for the next high… Best wishes, Jeff If you are interested in following and learning more about the SKI indices, I'll write another Report in three weeks or you can shell out the big bucks for a SKI subscription. Weekly Updates are available by subscribing for a month (or longer if you're wise and cheap enough to want to save money) at my website www.skigoldstocks.com for the princely sum of $30 (for a one month subscription) or more ($240 for an annual subscription). I also provide more frequent intra-week daily messages/alerts at a slightly higher price along with access to our informative Forum. ###  SKI archives SKI archives
email: jeff@skigoldstocks.com
Jeffrey M. Kern,Ph.D., is an academic psychologist with a specialty in the measurement and prediction of human behavior. The communications provided are for informational purposes only and are not intended to be investment advice or recommendations for specific investment decisions. Dr. Kern is not a registered investment advisor, but is registered as a commodity trading advisor (CTA). The information provided is considered accurate, but cannot be guaranteed. Investments/trading in narrow market segments or gold futures is for individuals willing to accept a higher level of risk for the opportunity of greater returns. Past performance is no guarantee of future performance. His website is www.skigoldstocks.com.
Communications should be sent to: jeff@skigoldstocks.com.
Copyright © 2002-2024 Jeffrey Kern. All Rights Reserved.
321gold Ltd

| 