 Special SKI Report #164 Special SKI Report #164
Gold Stock Update: Bullish Very Soon? Jeffrey M. Kern, Ph.D.
Email: jeff@skigoldstocks.com
USERX | historicals
Written Sunday Jan 24, 2016
Published Jan 25, 2016 Current USERX price = 4.73, Down 16 cents (3%) since the last report 3 weeks ago. Introduction (repeated from prior Reports):
I have been using my unique SKI indices
to predict price changes in the precious metals' market for more
than two decades. And my indices continue to mark the critical
points. I have initiated a subscription website since 1/13/06
(yes, Friday the 13th) after having posted free updates for years
at www.321gold.com. SKI is a timing service; although
almost everyone seems to believe that market timing is impossible,
that IS what the SKI indices have done for 36 years.
The SKI indices contain short-term (16-20
trading days), intermediate-term (35-39 trading days), and long-term
(92-96 trading days) indices. A more comprehensive description
of these mathematical indices and their history is found here.
Basically, the indices compare today's price to prices from a
specified prior time period. The name of the index specifies the
time period (e.g., 92-96 index = compare today's price to prices
from 96, 95, 94, 93, and 92 trading days earlier). Although I
use the oldest gold mutual fund, USERX, for analyses, the predictions
are applicable to the broad precious metals' market. I do not
recommend or analyze specific stocks, but my subscribers from
around the world regularly discuss individual issues on our Forum.
In addition to the truly unique SKI indices, I also use "run
patterns" to guesstimate turning points in the precious metals'
market. A "run" refers to a pattern of daily up and
down market closing prices. If the market has 3 consecutive days
of higher closing prices, the run is "3 up". If prices
then decline for 2 consecutive days, the run becomes "3 up
and 2 down". If prices then close higher the next day, the
run changes to "2 down and 1 up". Some people have referred
to run patterns as "worms". A run pattern is only completed
after the direction of closing prices has changed. I have compiled
a listing of every run pattern that has ever occurred and generated
probabilities that the end of the run marks a high or a low, moderated
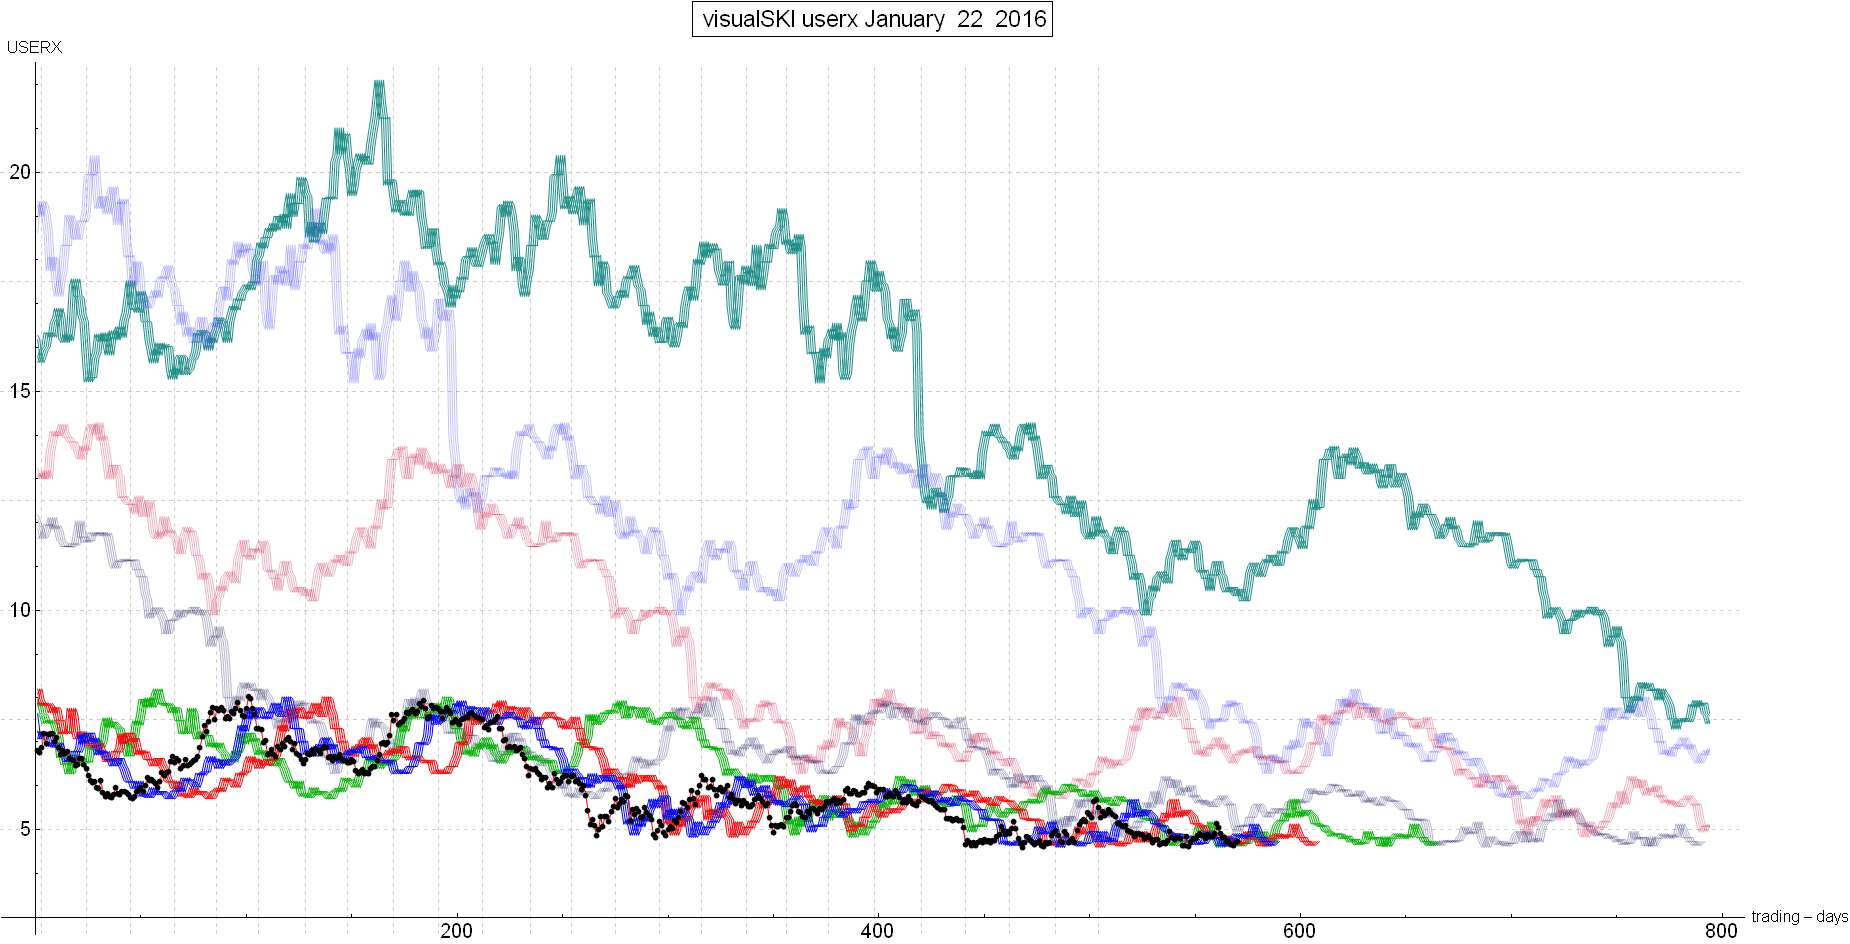
by the indices themselves. New Material The last gold stock SKI Report, written on Sunday 1/03/2016, described the possibility of a clearly bullish SKI index pattern. It concluded, “The SKI indices for USERX and the HUI are still bearish as of today. But the rare possibility of a master 92-96 index buy signal on a decline, along with additional index buy signals, is approaching over the next few weeks. At this point, it is just a possibility and I do not “know” if the index buy signals will occur. We would basically need a gradual decline. A rise would avoid the most clearly bullish possibilities”. After that Report, the gold stocks rose and avoided the “most clearly bullish possibility”. Nonetheless, the rise into 1/07/16 at USERX 5.13, DID generate multiple index signals. It’s common for technical points to be marked by multiple index signals. The last time that USERX went up to the 92-96 index (the green line on the SKI chart; see below), the index signal marked an exact high on 12/02/15 at USERX 4.96 (see the last two SKI Reports). This time, USERX went over the red line 35-39 index and the green line 92-96 index (see the chart below). Such index signals are expected to mark the technical point + or – 2 trading days. That means that the error has a standard deviation of one trading day. In this case, the index signals generated one day after 1/07/16 and executed 2 days after 1/07/16. History indicated that such index signals should be marking a short-term high (and gold had risen for a “classic” 5 consecutive trading days), but are also indicative of the beginning of a bull market! Therefore, Jeff bought a little on 1/11/16 as the commodity sector was plunging: Arch Coal declared bankruptcy and Freeport (FCX; the large copper miner) declined about 20%. The short-term decline was occurring but if USERX could remain above the green line 92-96 index, the bull market possibility would remain intact. However, the decline continued into this past week and went below the blue, red, and green lines almost simultaneously. The decline “killed” the immediate bull market opportunity, but, once again, such index signals are extremely likely to be marking the next technical point into 1/19/16 – 1/20/16. Are those index signals marking a technical break-down for another strong leg down, or, are they marking the next low? Frankly, Jeff does not “know”, but that WAS the next technical point. And if that was a low, USERX is set up to quickly generate new master 92-96 index and 35-39 index buy signals (by going back over the green and red lines, respectively) VERY soon here. Such buy signals would be occurring while the gold stocks were short-term over-sold, as opposed to the last buy signals occurring during over-bought conditions (“oversold” is objectively defined as USERX being below the blue line 16-20 index). Therefore, a short-term decline after such index buy signals would absolutely NOT be expected. Conclusion Just like the last SKI Report, SKI is bearish but is extremely close to generating new index buy signals under short-term oversold conditions. Such multiple buy signals would be close to the Triple Buy described in the last Report, but would be a Double Buy. Yes, it is possible that even those index buy signals could be marking a high and get stopped out quickly (by declining back below the green line 92-96 index), but this rare index pattern (IF it occurs here) would strongly suggest a continuing rise that can even have the characteristics of a true SKI bull market. This chance should be the “last one”: The sideways movement of the past many months (even 1 year) should/will end soon. Oh yes, examine the current SKI chart index lines. Best Wishes, Jeff If you are interested in following and learning more about the SKI indices, I'll write another Report in three weeks or you can shell out the big bucks for a SKI subscription. Weekly Updates are available by subscribing for a month (or longer if you're wise and cheap enough to want to save money) at my website www.skigoldstocks.com for the princely sum of $25 (for a one month subscription) or more ($200 for an annual subscription). I also provide more frequent intra-week messages/alerts at a slightly higher price along with access to our informative Forum and a managed gold futures program. The precious metals are in a very long-term (decade+) up-trend but are the most precarious, volatile, and psychologically difficult market in the world (in my opinion). That's the way it's always been. ###  SKI archives SKI archives
email: jeff@skigoldstocks.com
Jeffrey M. Kern,Ph.D., is an academic psychologist with a specialty in the measurement and prediction of human behavior. The communications provided are for informational purposes only and are not intended to be investment advice or recommendations for specific investment decisions. Dr. Kern is not a registered investment advisor, but is registered as a commodity trading advisor (CTA). The information provided is considered accurate, but cannot be guaranteed. Investments/trading in narrow market segments or gold futures is for individuals willing to accept a higher level of risk for the opportunity of greater returns. Past performance is no guarantee of future performance. His website is www.skigoldstocks.com.
Communications should be sent to: jeff@skigoldstocks.com.
Copyright © 2002-2024 Jeffrey Kern. All Rights Reserved. 321gold Ltd

|
