 Special SKI Report #180 Special SKI Report #180
Gold Stock Update: Bottom's in, Correction's complete Jeffrey M. Kern, Ph.D.
Email: jeff@skigoldstocks.com
USERX | historicals
Written Sunday Jan 1, 2017
Published Jan 2, 2017 Current USERX price = 7.04, Down 35 cents (5%) since the last report 3 weeks ago. Introduction (repeated from prior Reports):
I have been using my unique SKI indices
to predict price changes in the precious metals' market for more
than two decades. And my indices continue to mark the critical
points. I have initiated a subscription website since 1/13/06
(yes, Friday the 13th) after having posted free updates for years
at www.321gold.com. SKI is a timing service; although
almost everyone seems to believe that market timing is impossible,
that IS what the SKI indices have done for 36 years.
The SKI indices contain short-term (16-20
trading days), intermediate-term (35-39 trading days), and long-term
(92-96 trading days) indices. A more comprehensive description
of these mathematical indices and their history is found here.
Basically, the indices compare today's price to prices from a
specified prior time period. The name of the index specifies the
time period (e.g., 92-96 index = compare today's price to prices
from 96, 95, 94, 93, and 92 trading days earlier). Although I
use the oldest gold mutual fund, USERX, for analyses, the predictions
are applicable to the broad precious metals' market. I do not
recommend or analyze specific stocks, but my subscribers from
around the world regularly discuss individual issues on our Forum.
In addition to the truly unique SKI indices, I also use "run
patterns" to guesstimate turning points in the precious metals'
market. A "run" refers to a pattern of daily up and
down market closing prices. If the market has 3 consecutive days
of higher closing prices, the run is "3 up". If prices
then decline for 2 consecutive days, the run becomes "3 up
and 2 down". If prices then close higher the next day, the
run changes to "2 down and 1 up". Some people have referred
to run patterns as "worms". A run pattern is only completed
after the direction of closing prices has changed. I have compiled
a listing of every run pattern that has ever occurred and generated
probabilities that the end of the run marks a high or a low, moderated
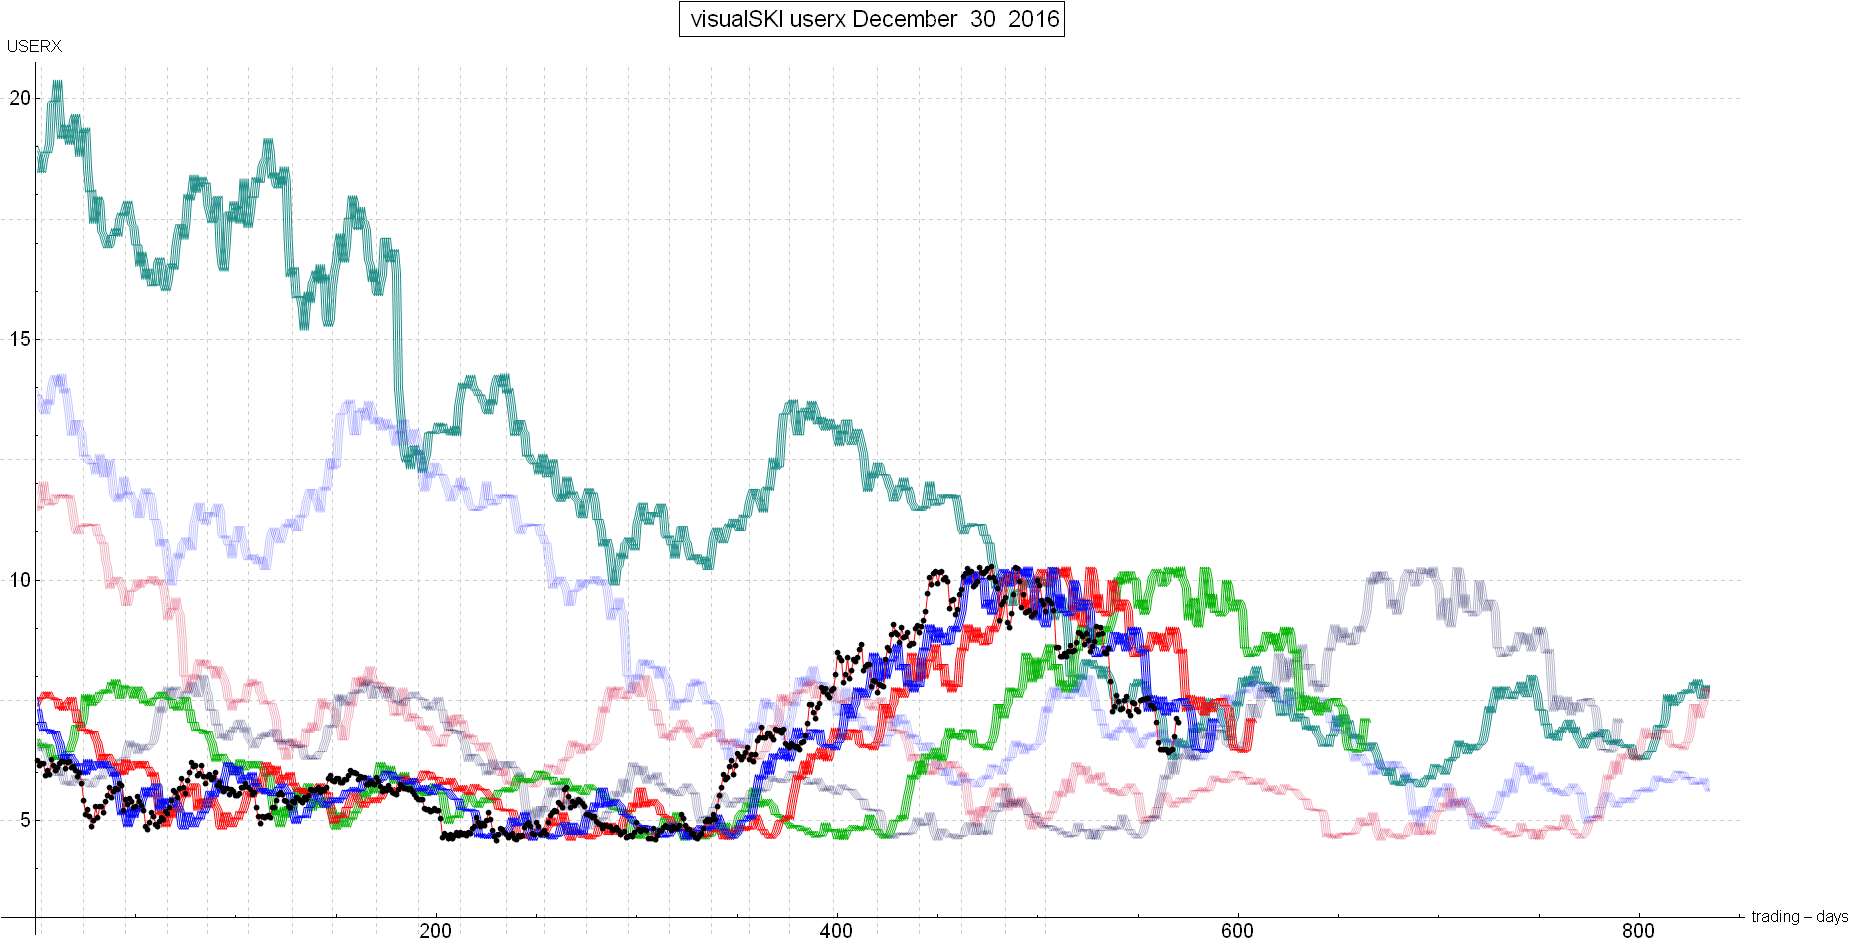
by the indices themselves. New Material The last SKI Report, written on Sunday 12/11/16, described how the gold stocks had held up from a 16-20 index buy signal on 11/11/16, but that the time period for an advance had almost expired: It was Day 19 in the 20-trading-day SKI index cycle and the next market phase wouldn’t begin for another 1-3 trading days. The 16-20 index’s resistance had already been hit/touched and the long-term 84 index resistance had also been hit/touched. That Report concluded that “a close below USERX 7.19 should be bearish”. USERX was then flat the next day (12/12/16) and when it declined on 12/13/16, time was up and Jeff recommended selling. And then the next day (12/14/16) was the U.S. Federal Reserve announcement day. The gold stocks rose in the morning but then plunged in the afternoon with USERX clearly going below 7.19. Therefore, a short position was activated. The gold stocks then plunged again on 12/15/16 in an apparently bearish manner, BUT USERX was forming a special SKI run pattern of 1 Down, 2 Up, and a strong run of 5 trading days. Such runs down almost always end at 5-6 down days, so SKIiers were instructed to already cover short positions on 12/15/16 (as USERX plunged to 6.62) and 12/16/16 (as USERX declined again to 6.47). Such rare run patterns “can” mark major lows (as well as major tops when they occur at multi-year highs). The last such run pattern ended on 12/16/2014 and marked a multi-month low at USERX 4.82. The plunge came right into a rare “confluence” (grouping) of the long-term SKI indices: The master 221 index, the contrarian 663 index, and the contrarian 884 index. The 221 index is the long-term equivalent of the 92-96 index and if it sold, it would likely be bearishly marking a continuing decline for multiple years. That index’s highest back price was at USERX 6.40, but USERX held above that index despite a 6-cent dividend on 12/22/16 that caused USERX to close at 6.42. Also of importance was that USERX had fallen below the 663 index that compares the current price to prices from 660-664 trading days earlier. Since it’s a contrarian index, the decline to below that index yielded a 663 index BUY signal. We therefore had a potentially bullish special run pattern complete at USERX 6.47, and a long-term 663 index buy signal just as USERX was holding above the master 221 index. A decline to below USERX 6.47 would have been very bearish by going below the bottom of the run down and also likely selling that 221 index. USERX then closed at 6.48 (on 12/19/16), 6.48 (on 12/20/16), and back to 6.47 (on 12/21/16), so that was a “nail-biter” technical point. USERX then dropped to 6.42 on 12/22/16, but that was due to a 6-cent dividend, as USERX actually rose one penny on 12/22/16. Conclusion After buying as the SKI 92-96 index bull market began on 1/25/16-1/26/16, turning wary in July, and becoming outright bearish after a perfect top (to the penny) at USERX 10.28 on 8/18/16, SKI has provided multiple indications that THE corrective bottom has completed. We had a special run pattern and a long-term 663 index buy signal basically at the exact low. Here is the SKI-based Elliott Wave chartfrom 4 weeks ago. It’s “SKI-based” because the SKI index signals marked each wave point during the intermediate-term decline. It’s an ABC decline followed by an X-Wave top marked by a 92-96 index signal (where Jeff went short), followed by another ABC decline into what should be THE corrective low. This old chart was followed by the rise to hit the 16-20 index (and 884 index), as per the prior public SKI Report for 321gold for the expected Wave B top, and then the subsequent C-Wave plunge that was supposed to complete the correction. It apparently did so. In the short-term, USERX has now risen (this past week) back over the contrarian 884 index (that executed its resistance signal on this past Friday) and the contrarian 663 index for multiple index resistance signals, as depicted in this up-to-date chartof the SKI indices (the faded purple line is the 221 index; the faded blue line is the 663 index; the turquoise line is the 884 index). Therefore, some short-term decline is expected, but a multi-month rise is expected and (based upon the 221 index) new multi-year highs in the gold stocks are predicted by early summer 2017 (or else the 221 index will sell). This is the next long-term bullish SKI Report since January 2016. Yes, it’s time to join SKI and Jeff. If you’ve been reading these SKI Reports for a while, you know that I sometimes do NOT recommend subscribing due to uncertainty or expected flatness… Best Wishes for the New Year and a new 92-96 index SKI bull market in a couple of months as USERX rises above the declining green index line, falls below it, and then rises over it again (all while staying above the rising faded purple index line), Jeff If you are interested in following and learning more about the SKI indices, I'll write another Report in three weeks or you can shell out the big bucks for a SKI subscription. Weekly Updates are available by subscribing for a month (or longer if you're wise and cheap enough to want to save money) at my website www.skigoldstocks.com for the princely sum of $25 (for a one month subscription) or more ($200 for an annual subscription). I also provide more frequent intra-week daily messages/alerts at a slightly higher price along with access to our informative Forum. ###  SKI archives SKI archives
email: jeff@skigoldstocks.com
Jeffrey M. Kern,Ph.D., is an academic psychologist with a specialty in the measurement and prediction of human behavior. The communications provided are for informational purposes only and are not intended to be investment advice or recommendations for specific investment decisions. Dr. Kern is not a registered investment advisor, but is registered as a commodity trading advisor (CTA). The information provided is considered accurate, but cannot be guaranteed. Investments/trading in narrow market segments or gold futures is for individuals willing to accept a higher level of risk for the opportunity of greater returns. Past performance is no guarantee of future performance. His website is www.skigoldstocks.com.
Communications should be sent to: jeff@skigoldstocks.com.
Copyright © 2002-2024 Jeffrey Kern. All Rights Reserved. 321gold Ltd

| 