>
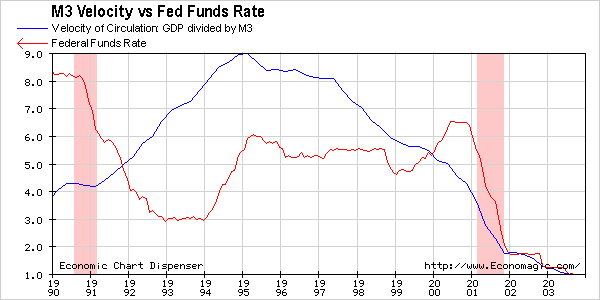
Where did all the money go?David Chuhran After doing the research for my last 2 editorials I started thinking (scary thought, I know), "Where did all the money go?." The last thing I wrote about was the impact the velocity of money and the Fed Funds Rate had on the money supply. I discussed it in the broadest terms and I don't intend to go any deeper because I think the answer lies close to the surface. I went back and looked at some combinations in an attempt to figure out the answer to my question. The first chart shows M3 Velocity against the Fed Funds Rate. Again, M3 Velocity is basically the speed at which the broadest measure of money supply circulates and is turned over creating economic activity. This gives you a rough idea of the temperature of the economy. The Fed Funds Rate, as discussed before, is the short term interest rate the Fed uses as the gas pedal or brakes to control the economy. I took a look back before the last recession (shown in pink shading) to the present. The left scale shows interest rates. I removed the M3 Velocity scale because the numbers were irrelevant, but the line itself speaks volumes about the trend.
First, notice that interest rates were up above 8% (red line) in 1990 as we entered a recession. The Fed, realizing the economy needed stimulus, pushed on the gas pedal by dropping interest rates by over 5% in 2 years. Notice the corresponding rise in the M3 velocity (blue line) as it responded to the Fed's foot pushing on the gas pedal. As a matter of fact, M3 responded so well that the economy began to get too hot, so in '94 the Fed began braking to slow the economy down by raising rates back to 6% over the course of the year. See how that rate hike flattened out the M3 velocity through mid '97. Rates were kept in the 5-6% range all the way through the tech bubble run-up while the M3 velocity continued on a steady decline. About mid '99 the Fed decided to put the brakes on again by hiking rates just under 2% over the next year. It's apparent to me that it wasn't due to an overheated economy, but more likely due to an overheated stock market. The Nasdaq topped out in March 2000 with the SnP following it down later in the year. Look at the end of 2000 where the Fed began the first of 13 rate cuts in a desperate attempt to stop the stock market's decline and also to reignite the economy as we entered another recession. Notice how they put the gas pedal all the way to the floor and the M3 velocity continued to drop. It failed to respond to this traditional stimulus, so what was going on? I needed to look further and decided to look at M3 against GDP. I wanted to see if I could find any relationship between the broadest measure of the money supply (M3) and our Gross Domestic Product. We had obviously, by definition, exited the recession, but the economy seemed to be languishing. You have to ask yourself, "If the recession was over in 2001, then why is everyone still talking about the recovery 2 years later?" It just seems like an awful long time to be recovering while the TV analysts are trumpeting the new Bull. It just doesn't make any sense, so here's what I found.
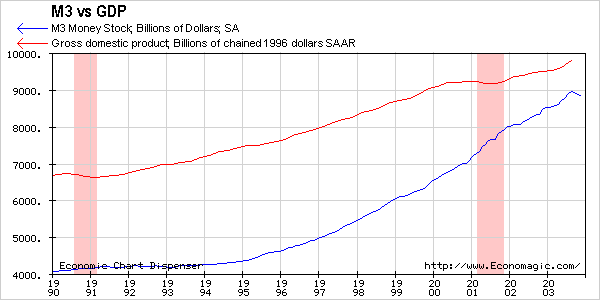
Taking a look back to the beginning of 1990 notice how flat M3 remained all the way through 1995. There was a $300 billion rise in M3 over those 5 years with a corresponding $770 billion rise in GDP. In other words, it took a 38 cent rise in M3 to generate a $1 rise in GDP. That seems like a pretty reasonable return, but then everything changed and I can't really pinpoint the exact point, time, or event and I can't say with certainty that it was directly related to the change in Treasury Secretary. I'll let you draw your own conclusions there. Nevertheless, in mid '95 the dynamics changed. Between March '95 and March 2000, we experienced a $2.3 trillion rise (~+50% in 5 years, WOW!) in M3 while we only gained $1.6 trillion in GDP. What? Now it took a $1.43 rise in M3 just to get a $1 rise in GDP. That's quite a turnaround. You can visually see the convergence in the chart showing that it was taking more and more growth in the money supply to generate the same rise in GDP. This bothered me and it appeared to get worse as we approached the point where the Nasdaq began its decline. I noticed a flattening in GDP growth while M3 began a steeper climb, so I expanded that period to get a better look.
Between the Nasdaq top in March 2000 and the end of the recession (pink shaded area) we only grew GDP by $90 billion while M3 grew by another $1.2 trillion. Remember, this was period of time where the Fed initiated most of the 13 rate cuts while M3 velocity was plunging and failing to respond to that Fed stimulus. Over these 18 months it took a M3 growth of $13.33 to achieve a $1 rise in GDP. That M3 growth was not translating into growth in the GDP. Much of that growth in M3 must have been pure liquidity injections by the Fed and while the GDP growth has resumed a modest climb, the M3 growth rate is still disproportionately high. I do realize that we had 8.2% GDP growth in the last quarter, but that still isn't enough to account for the rapid rise in M3 while GDP remained relatively flat in prior quarters. So, where did the money go? It's my belief that since the unprecedented increases in M3 continued to show diminishing returns in GDP growth, and while the Fed had the low interest rate gas pedal to the floor with a plunging M3 velocity, I can only surmise that the additional money supply found its way into the stock market fueling the current bear market rally. Lastly, notice the tail end reversal of M3. That's contraction of the money supply. With interest rates at 1%, M3 velocity grinding to a halt, and the pure liquidity injections failing to hold up M3, I believe we will see an outflow from the equity markets unless that trend can be stopped and M3 growth resumes. I don't believe they can stop it without completely debasing the dollar and risking its total collapse, therefore I believe that once the equity market outflow begins it could be quite severe. David Chuhran |


